UAV Flights at Mono Lake
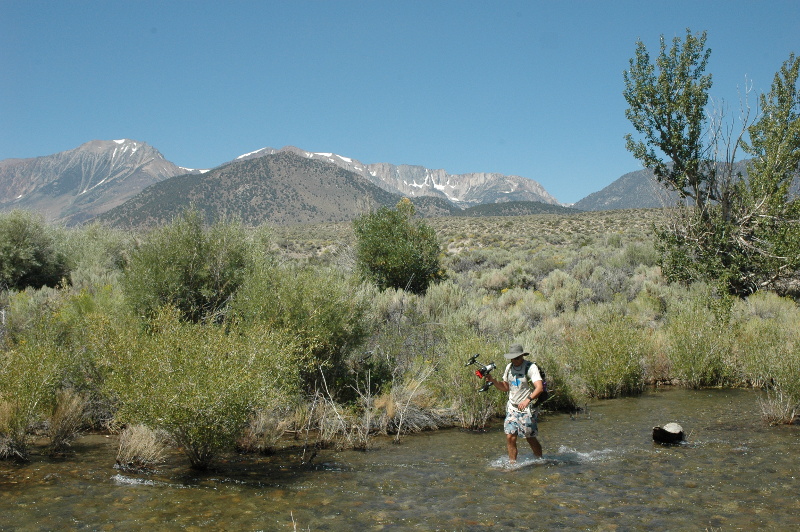
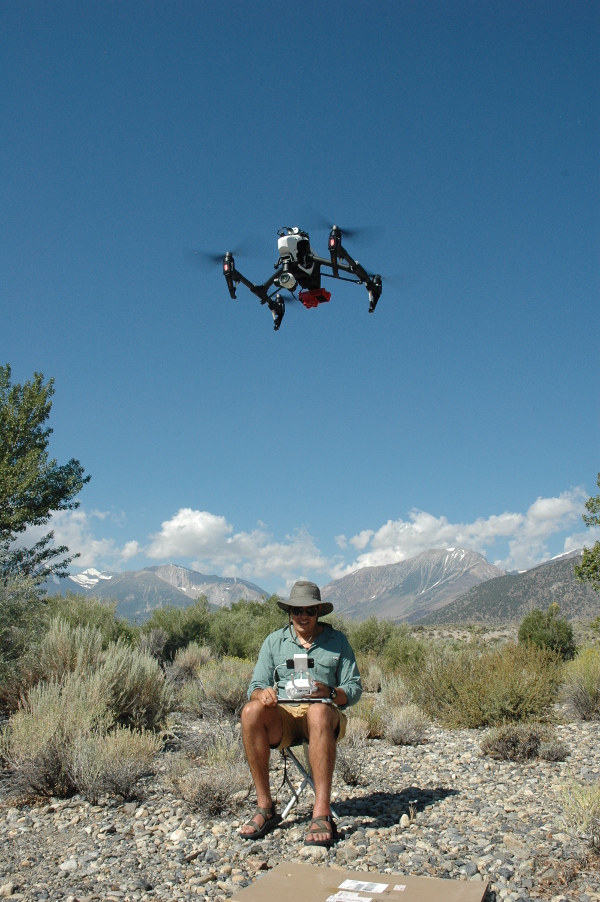
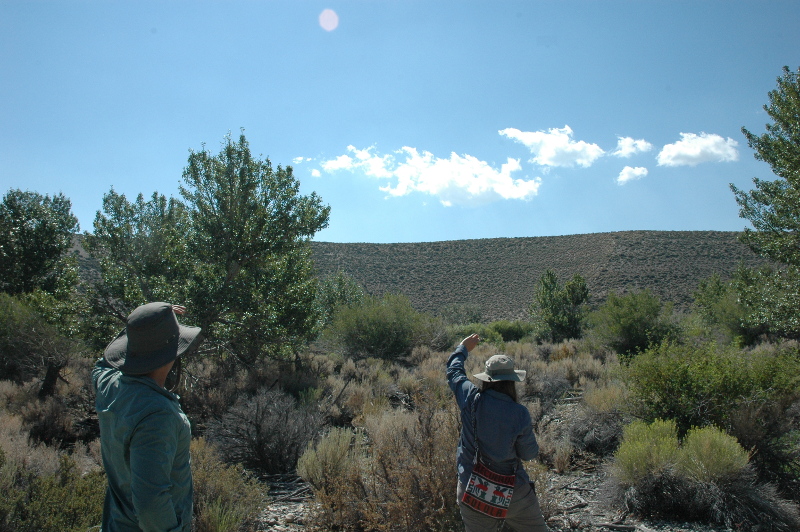
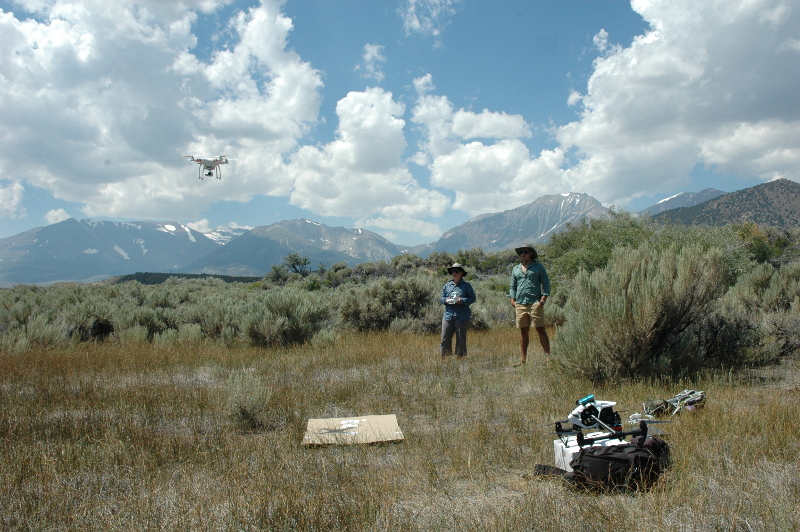
During the last week of summer in 2017, Jordan Adair and Dr. Jim Graham traveled to Mono Lake in south-eastern California. Their task was to develop a plan for monitoring the vigor of plant life along Rush Creek which drains into Mono Lake. Existing satellite and aerial photography was already to found to be lacking so they investigated using UAVs (drones) for high-resolution data acquisition. They were also interested in determining if UAVs were capable of determining the active width of the creek. The end result was over 50 UAV flights were executed and over 500Gig of data produced. In addition a few videos were created to capture the dynamics of the ecosystem. In 2018, Jordan Adair returned to Rush Creek and collected additional UAV Imagery
The data included visual and infrared imagery which is still be unprocessed. Below are some samples of the images, photos of the area, and information on the flights. The infrared images were captured with a modified Inspire 1 with a RedEdge sensor.
Jordan also flew for Sara Matches as part of her research into using UAS to monitor bird populations at Mono Lake.
Rush Creek is at the south-western edge of Mono Lake and is one of the creeks that was damned and partially diverted to Los Angeles. Dr. Bill Trush has been studying the effect of recent increases in releases on the vegetation and course of the creek.
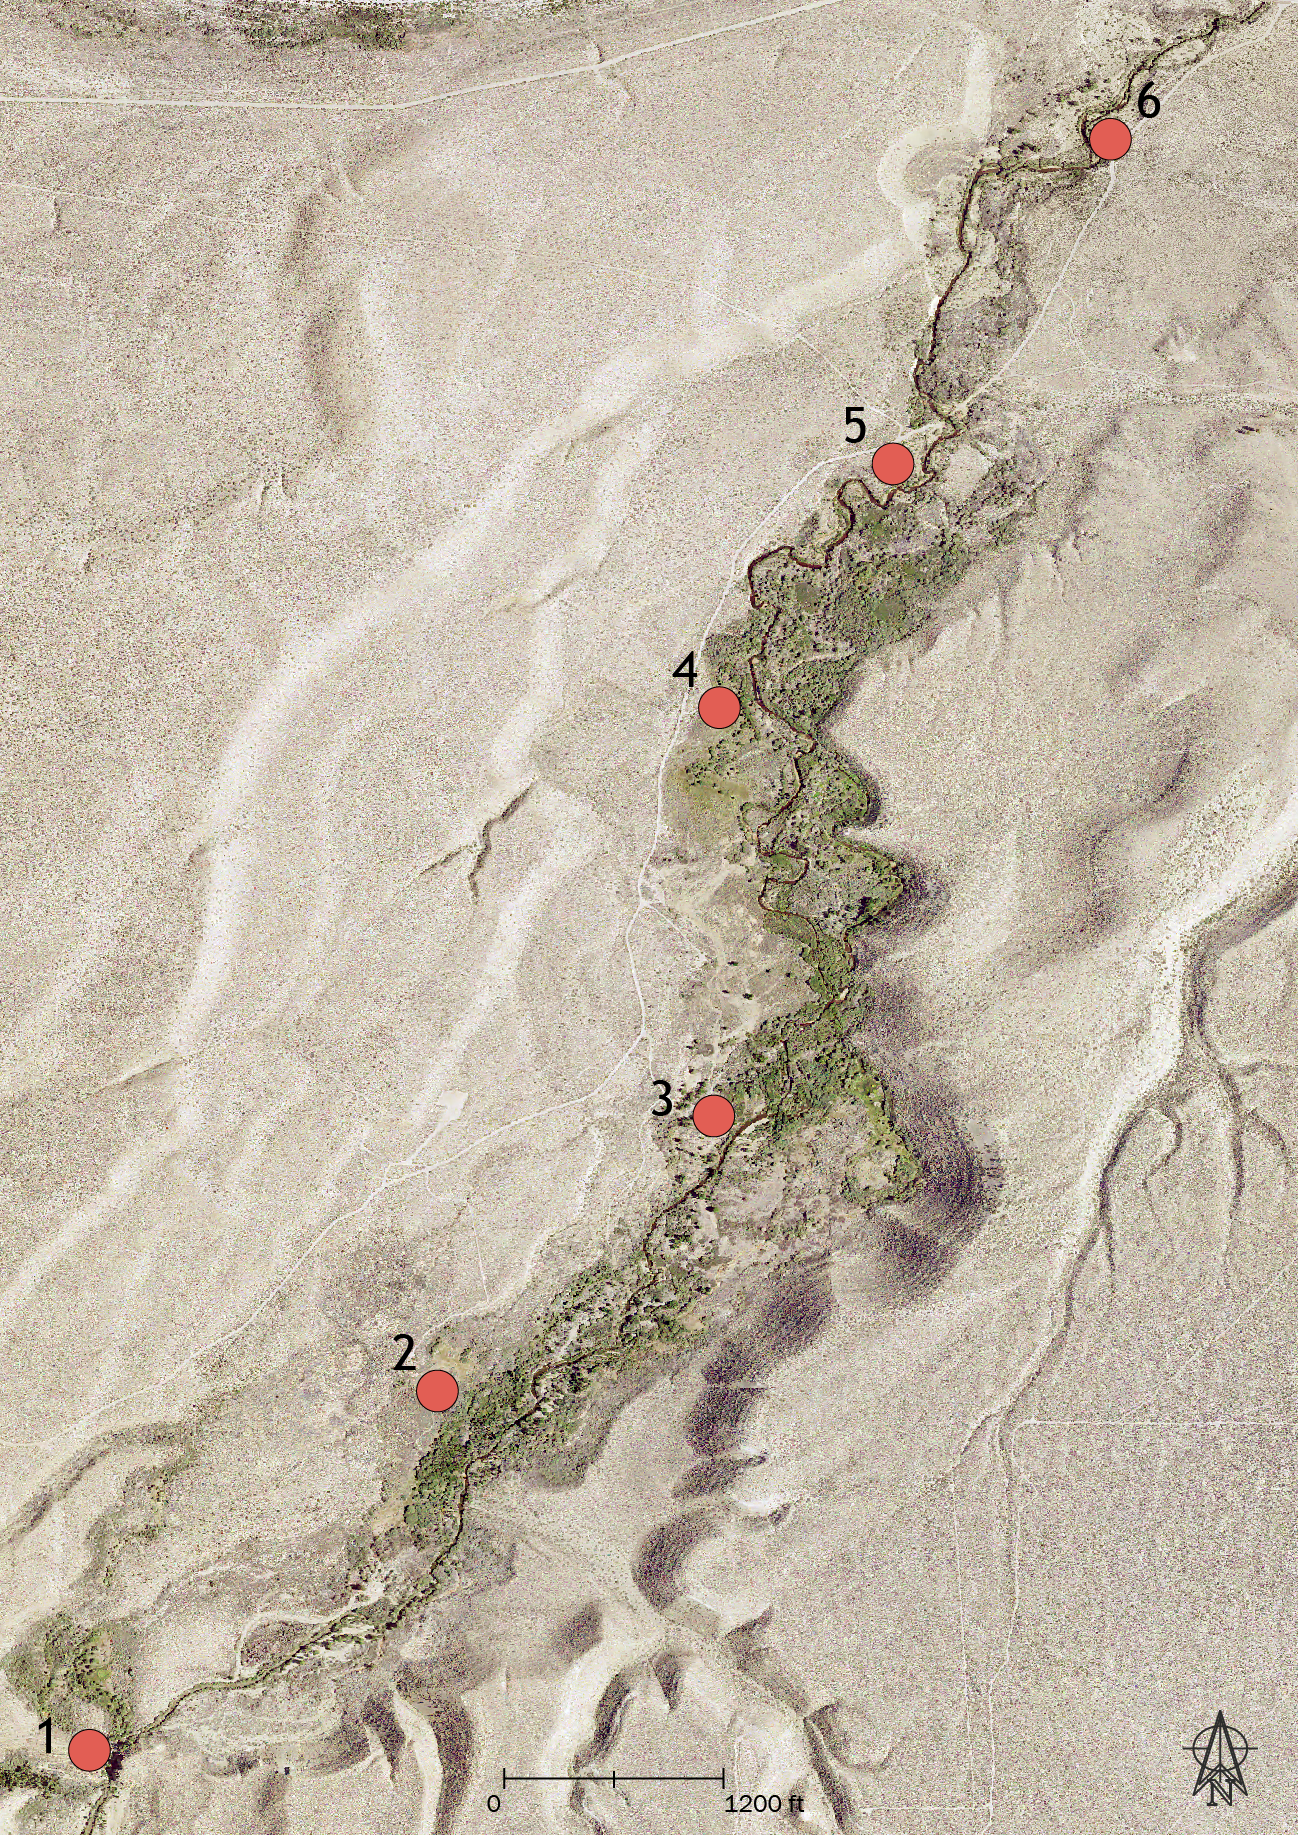
Sample Images from Site 5
Below are two samples of the images collected at Rush Creek. The top one is a visual spectrum image with red, green, and blue values (RGB). The bottom image is the Non-Differentiated Vegetation Index (NDVI) which shows area of high vegetation vigor in higher (lighter) values with areas without vegetation with lower (darker) values. Click on the images to see the full resolution of the images.
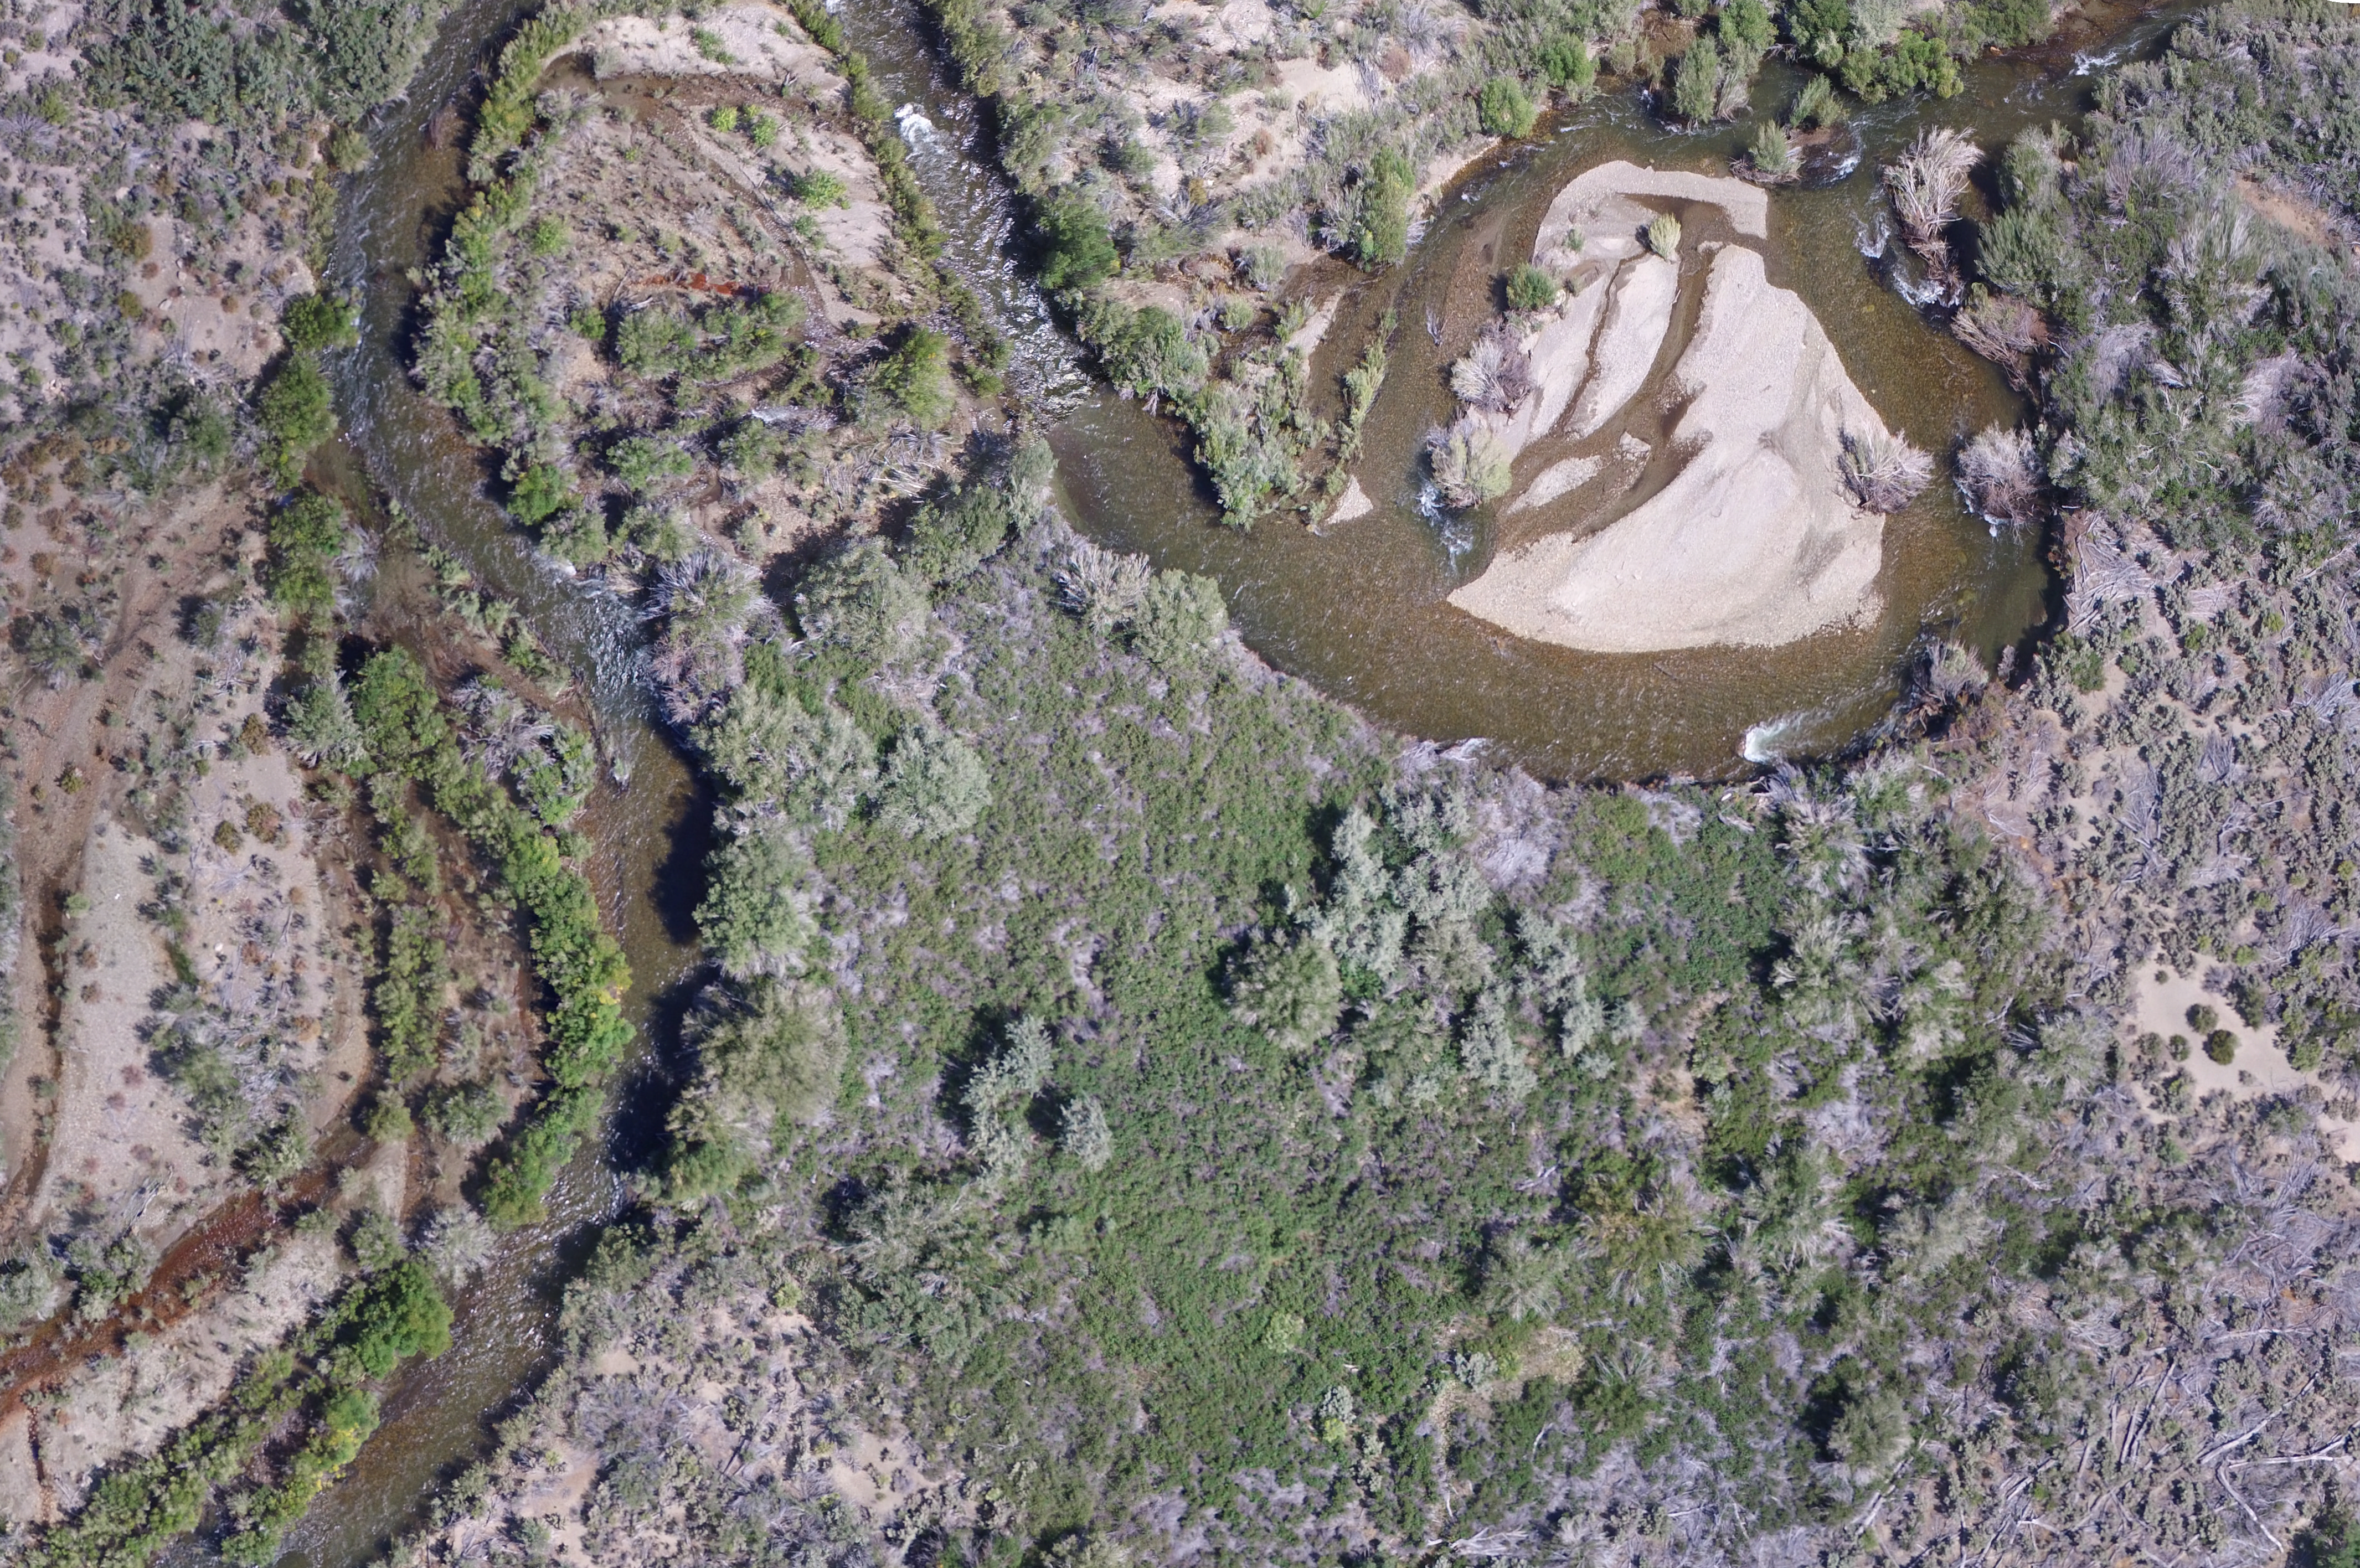
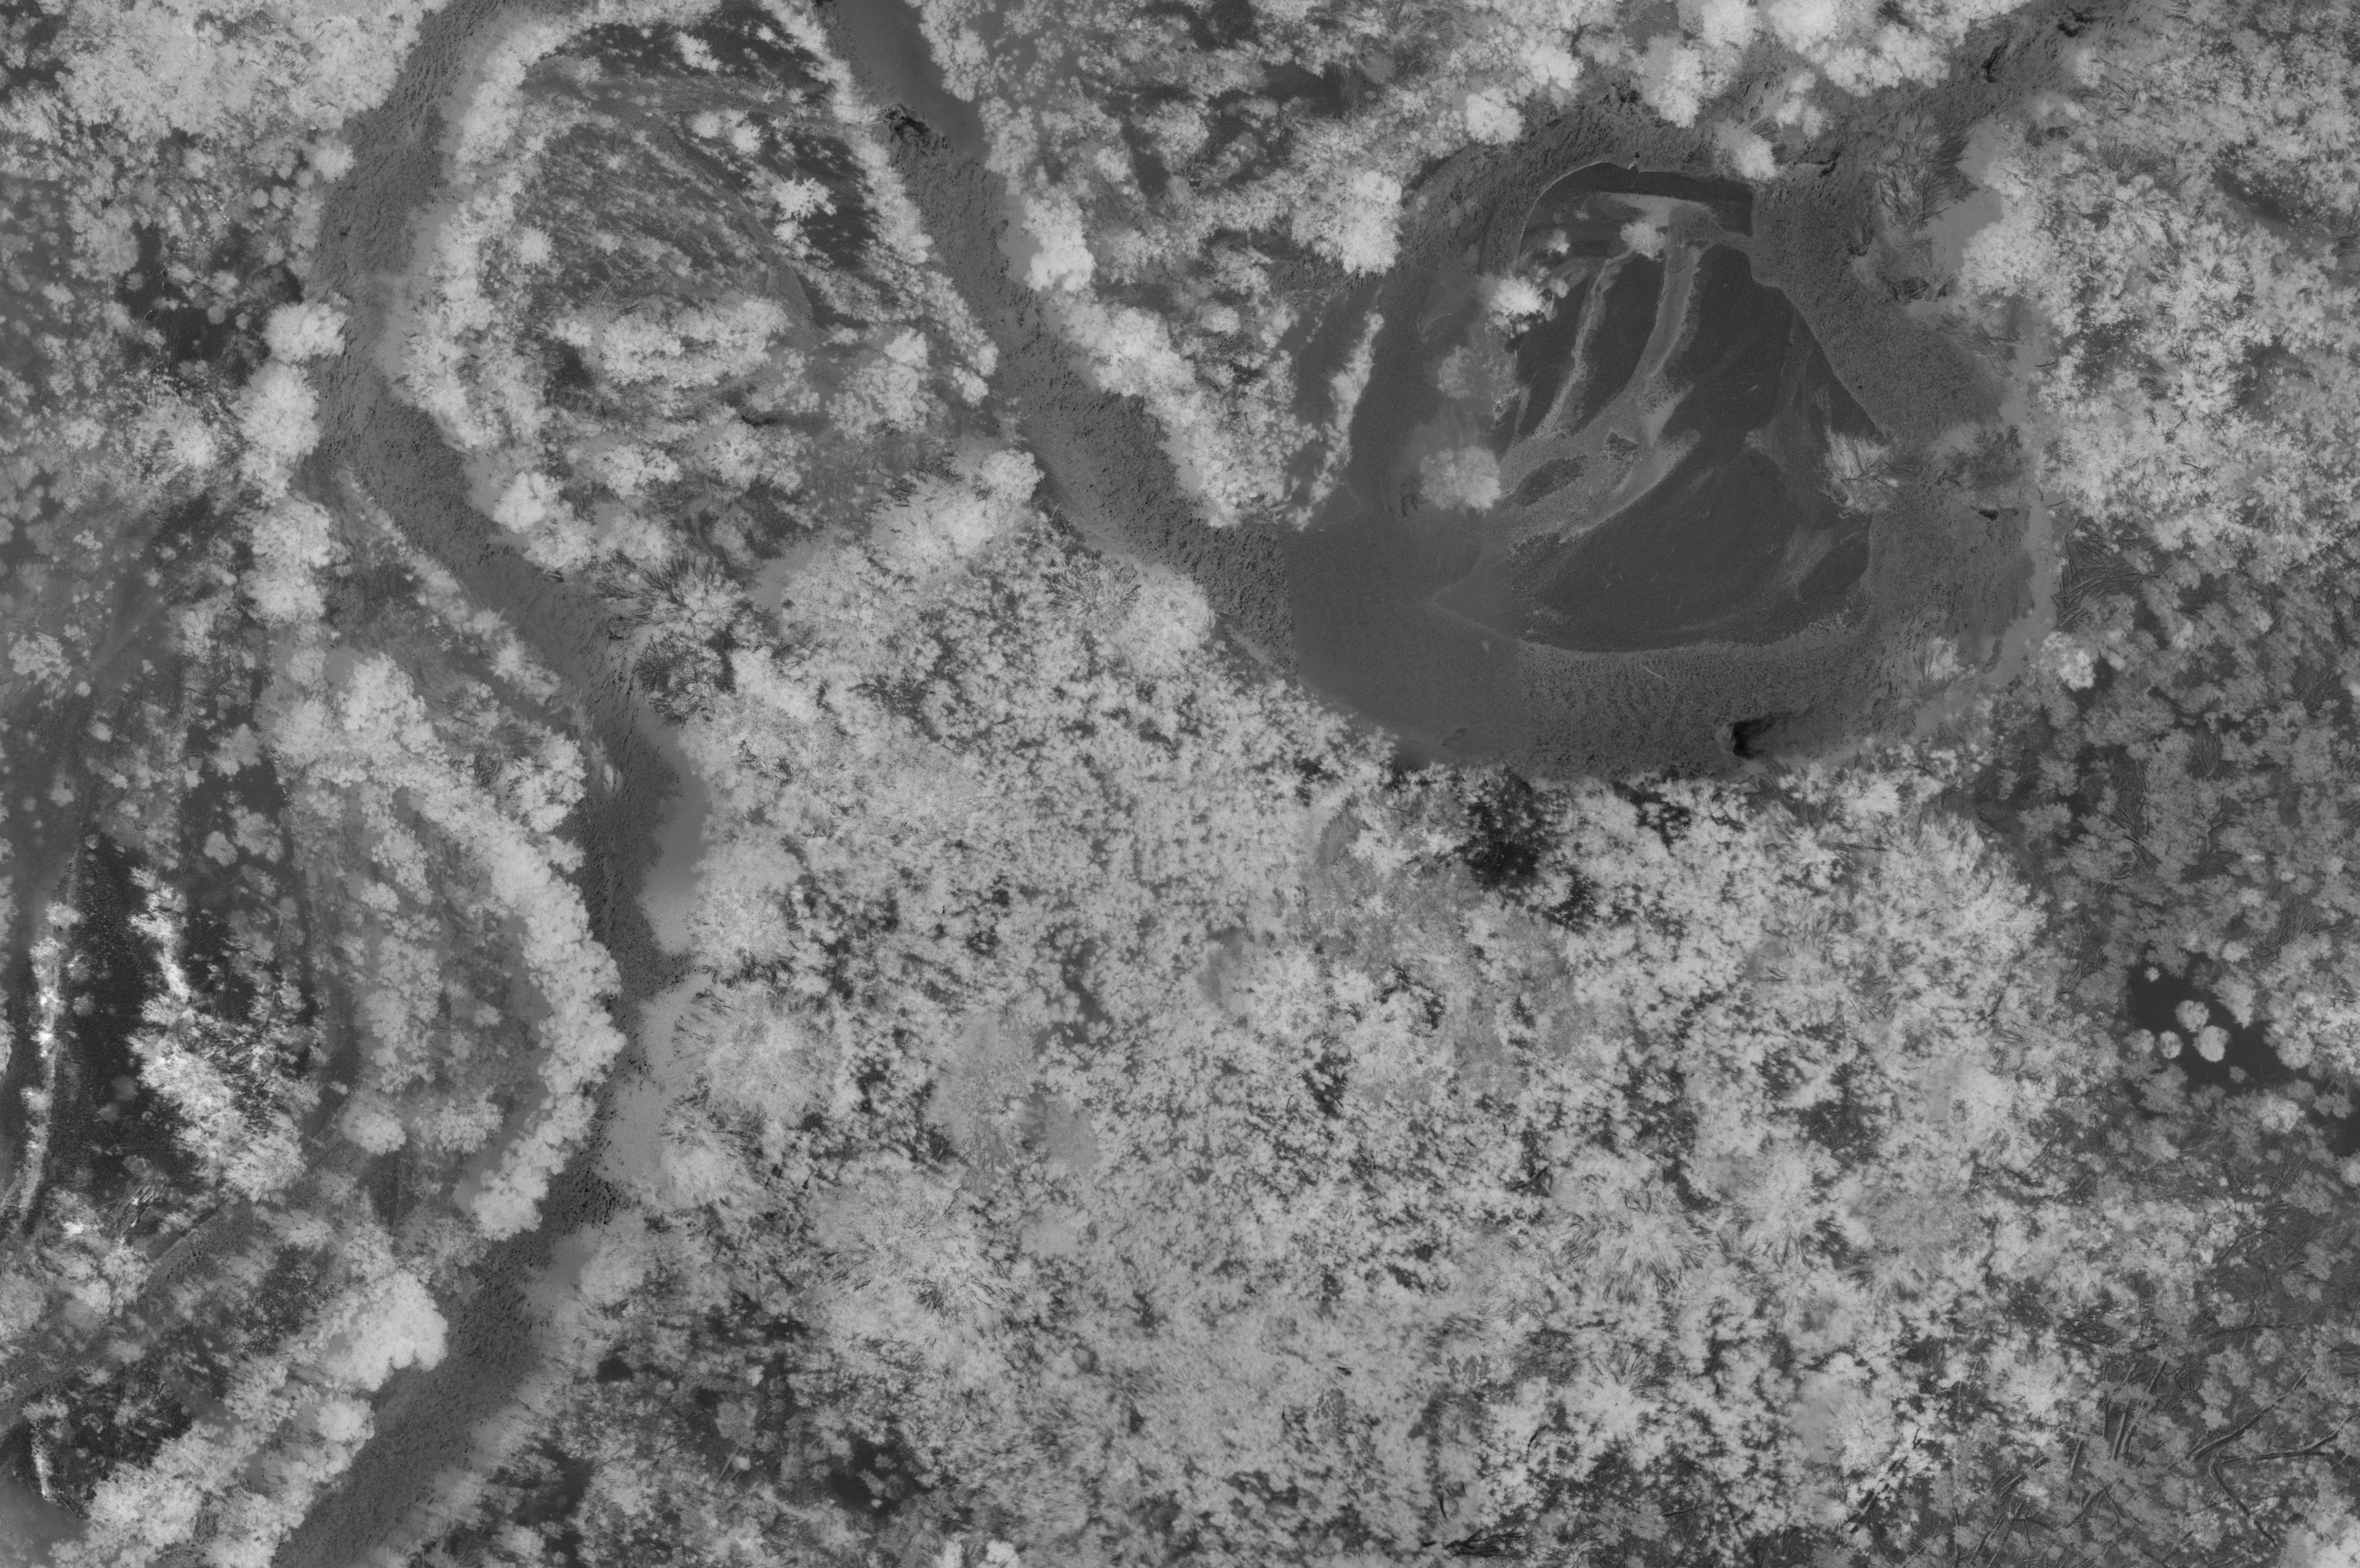
From these images we can see the sand bar with little vegetation is dark (near 0 vegetation vigor). The cottonwoods and willows along the stream show the highest vigor. As we move away from the stream channel and into the uplands, we see the NDVI decrease as we move into driver areas dominated by sage and rabbit brush.
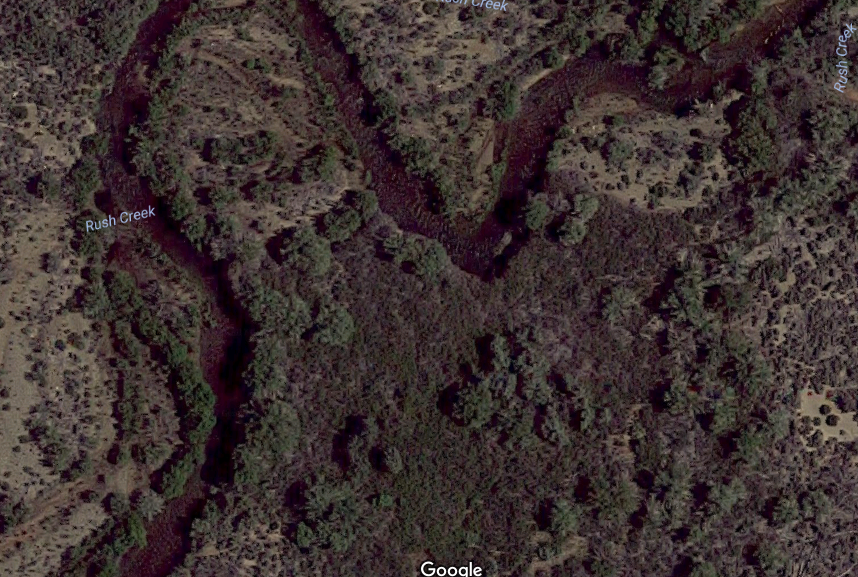
The image above was taken from GoogleMaps and is about 30 centimeters per pixel and the image shows the full resolution. Notice the area on the right that is now a sand bar. These images show the dramatic changes that have occurred at Rush Creek during the 2017 flooding at resolutions that are only possible with a UAV.
CONTACT |
RELATED SITES |
HSU GEOSPATIAL |
RESOURCES |
|
|
|