Tutorials
The tutorials below are designed to introduce you to CanvasMap and also to provide a reference in the future. The first 4 tutorials will get you familiar with how CanvasMap works and how to control it from JavaScript. Then, download CanvasMap from one of the links below and go on to tutorial 5 where you will add your own data to your own CanvasMaps.
Editor Tutorial - new tutorial to use the CanvasMap editor extension.
 |
1. Introduction to CanvasMapThis tutorial will show you examples of maps that "flow" with content and "resizeable" maps and the full, default, interface for CanvasMap. The following tutorials will show you how to customize aspects of the map and add your own data. |
 |
2. Layer Names and Map Extent |
 |
3. Styling Data In A MapHow to change the fill color, line color, marks, and icon images for map data. |
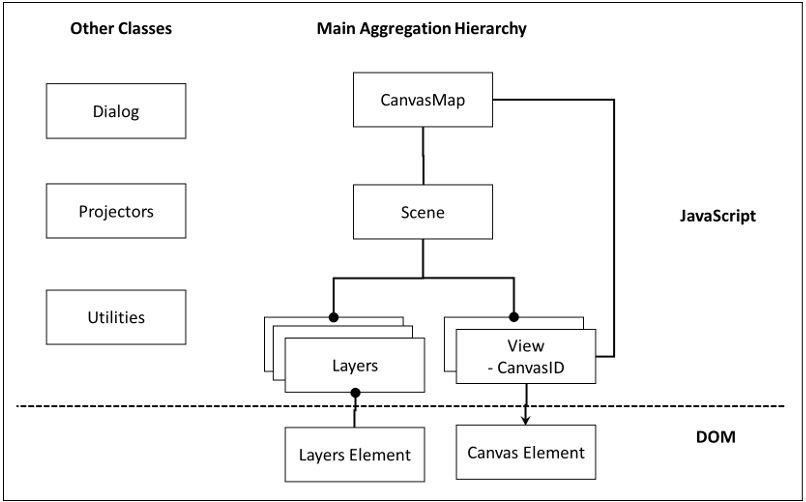 |
4. Design of CanvasMap |
 |
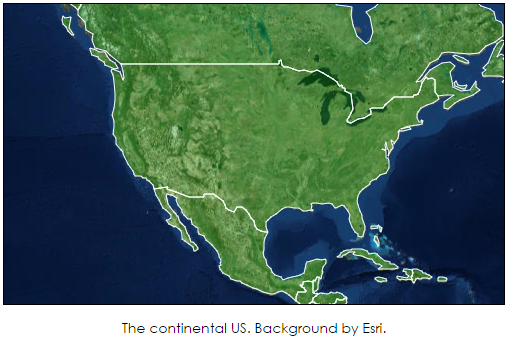
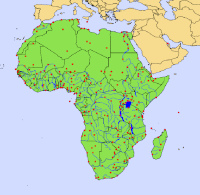
5.Creating Your Own MapsHow to create maps with your own data, work with CanvasMap settings, and add labels and rasters to maps as in the geographic map of Africa example . |
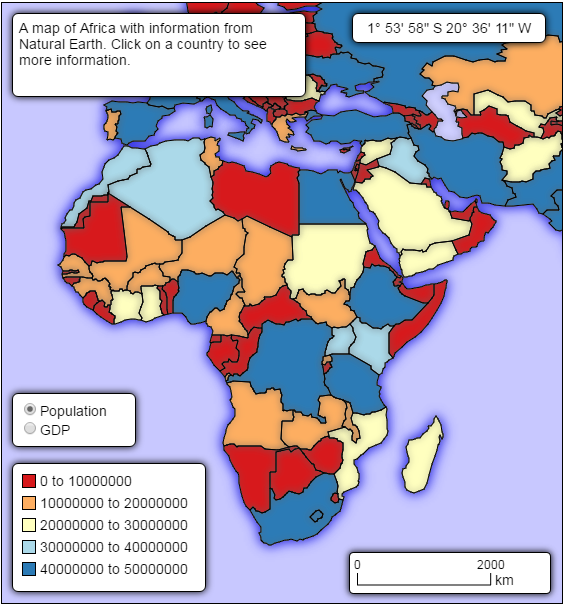 |
6. Customizing the look of the mapHow to change the appearance of the may by turning elements on and off, stylizing them with CSS, and changing the contents of the map elements as in the thematic Africa map example.
|
 |
7. Google Mercator and OpenStreetMap TilesHow to create a simple map with the Google Mercator (a.k.a. Web Mercator) projection and backgrounds that use the OpenStreetMap tile standard. Then, how to add custom elements to the map to control the foreground and background layers. Then, how to make maps resizable and how to add tools for drawing rectangles, ovals, and polygons. |
 |
8. Creating a UTM MapHow to create maps in any projection, add north arrows and graticules, and add custom points using JavaScript. |
 |
9. Working with Large Data SetsHow to keep your maps running with increasingly large datasets. |
|
10. Overriding Events |
 |
11. AnimationCreate and control simple animations with CanvasMap. |
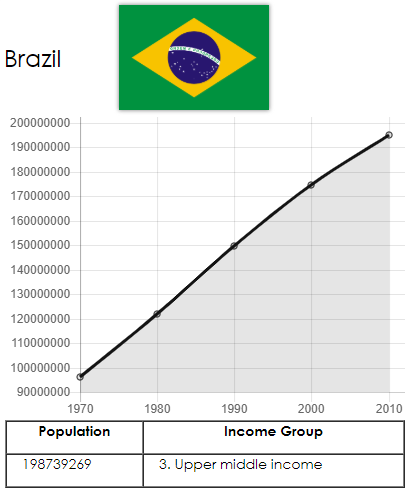 |
12. Adding ChartsHow to add interactive charts with Chart.js |
 |
13. The CanvasMap EditorHow to use the CanvasMap graphical editor. |
Special Topics
1. Project On Load
Shows how to load geographic data into CanvasMap and then project it to WebMercator for display.
2. Adding Tools to Create Items
Adding tools for the user to draw items on the map.
3. Customizing the map
Different ways you can change the appearance of the map.
4. How the code works
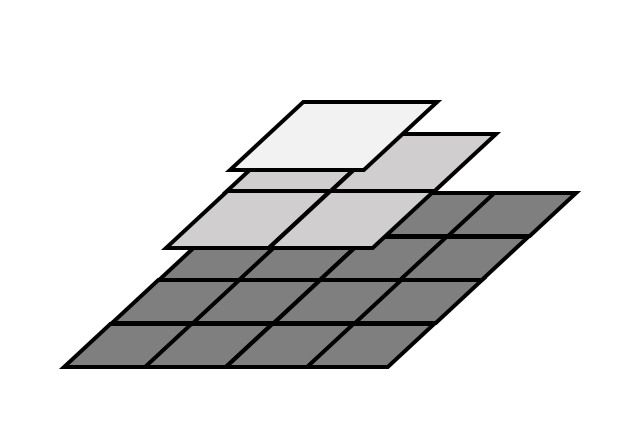
An overview of how CanvasMap works
5. Custom Layers
How to create your own layers
6. Setting up a Web Server
Setting up a server on your own computer for development.
7. Changing the Behavior of the Map (the view mouse down)
Overriding the Views MouseDown() function
To be added to tutorials:
- Creating dialogs?
- MouseOverStyle, SelectedStyle
- Change the pop element by changing CM_InfoBox style.