Data Collection With ESRI Collector App
Part 1: Preparing your data in ArcMap
Try not to spend more than 1 (one) hour on this part
In this part of the lab, you will build a feature layer to use for data collection. You will create a geodatabase in ArcMap, create domains, add a feature class, and add the correct field types and configure them to meet the requirements of the data collection form. This is the equivalent of a data dictionary used with Trimble Terrasync. Once you have configured the information model, you will build a map in ArcMap and publish a feature service to your organization. In the next part of the lab, the feature service will be leveraged as a layer in a map that can be used to collect information in the field. We will use the ArcGIS online account that we created for lab 12.
Create your geodatabase
Geodatabases organize and store the data that you collect. Ultimately you will create a feature class to store the data that you will collect about street conditions on HSU campus. We will need to configure and collect attributes that are very similar to the ones we collected with Terrasync in labs 7 and 8. First you need to create the geodatabase that holds the feature class. Take the following steps to create a file geodatabase by using the Catalog window in ArcMap.
- Create the lab 10 Workspace in your TempData folder as usual
- Start ArcMap and open the Catalog window
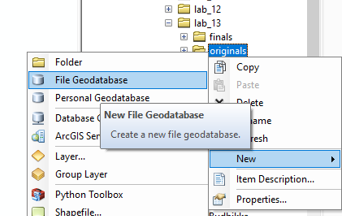
- Right-click the file folder in the Catalog tree where you want to create the file geodatabase
- Point to New
- Click File Geodatabase to create a new file geodatabase in the location you selected. Name your geodatabase collector_lab
Define geodatabase domains
Some fields in your data should be populated from a set of choices. By creating domains in your geodatabase, you provide a list of choices data collectors can choose from when they are working. This is the equivalent of a MENU attribute in the data dictionary. Later in this lab, when you set up the fields, you will use the domain.
- In the Catalog tree, right-click the geodatabase and click Properties
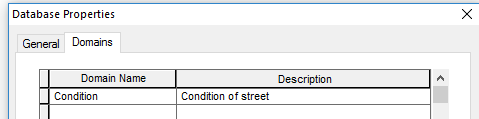
- Click the Domains tab
- Click the first empty field under Domain Name and type Condition for the new domain. Press the Tab key or click the new domain's description field, and type Condition of street
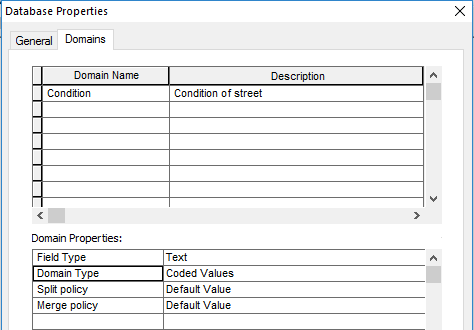
- Under Domain Properties, click the field next to Field Type and under the pull down menu, select Text. Leave everything else as default
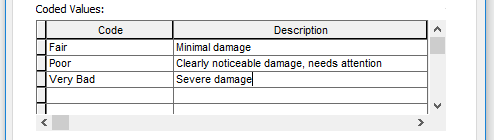
- Click the first empty field under Coded Values and type Fair for the first valid code
- Press the Tab key or click the coded value's Description field. Type Minimal damage as the user-friendly description for this coded value
- Repeat steps 5 and 6 until all valid values and their descriptions have been typed as shown below:
- Click OK to create the new domain in the geodatabase and close the dialog box
Define the feature class
Next, you will create the feature class to hold the collected information. Feature classes are essentially containers for information, where the pieces of information share similar characteristics, whether that be their geometry or their attributes.
- In ArcCatalog, right-click the collector_lab file geodatabase, point to New, and click Feature Class
- Type HSU_campus_streets_survey as the name for the feature class, type Street conditions as the alias, and choose Point Features as the feature type. Click Next
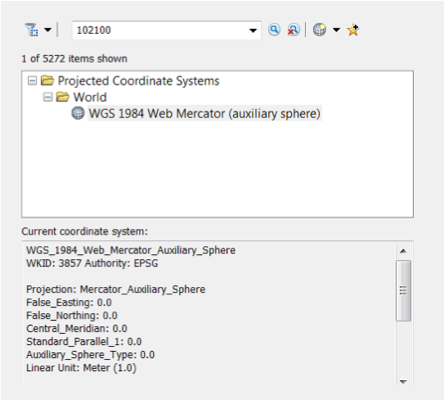
- When creating this feature class, you need to choose a coordinate system. Coordinate systems allow your features to be projected properly and accurately on a map, making the features appear in the correct locations. For this exercise, choose WGS 1984 Web Mercator (auxiliary sphere)
- Click Next to accept this coordinate system
- Click Next to accept the default XY Tolerance settings
- Click Next to accept the default database storage configuration
Note: A feature class is a collection of features that share the same geometry type and information model.
The New Feature Class wizard opens. It walks you through the necessary steps to customize the feature class.
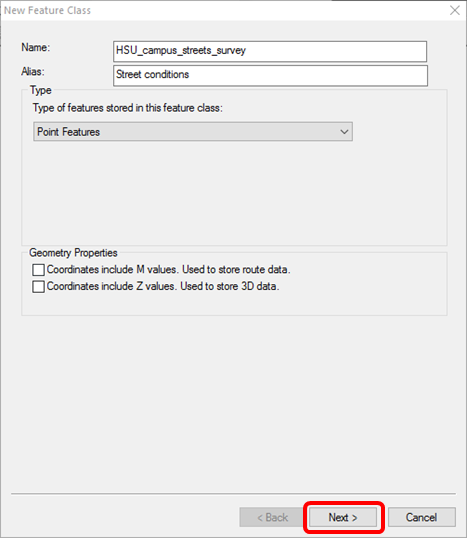
You may be wondering why we chose point type for streets, which are line features. The reason for this is that we need to record each damage incidence at the exact location.
Set up the fields
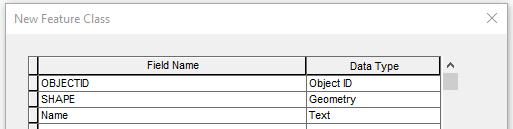
The fields are a key part of your information model. They provide the structure of the information you will collect and provide rules for the types of information collected about a feature
- The first field you create will be used to record the name of the street. Click the first empty row under Field name and type Name. Under Data Type, choose Text
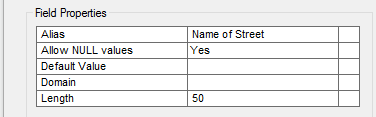
- Under Field Properties, click the field next to Alias, and change the default alias Name to Name of street. The alias is what your field-workers see on the data collection form, so it's important that it makes sense to them
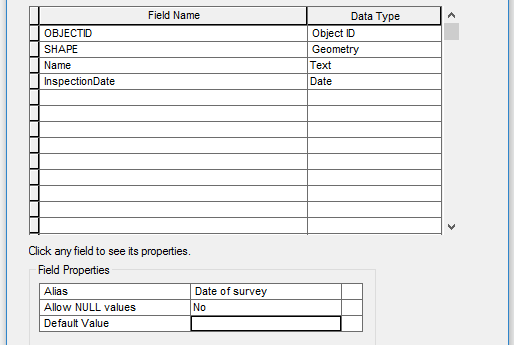
- Click the next empty field and type InspectionDate, then choose Date as the data type
- Under Field Properties, click the field next to Alias, and change the default alias InspectionDate to Date of survey. Set Allow NULL values to No
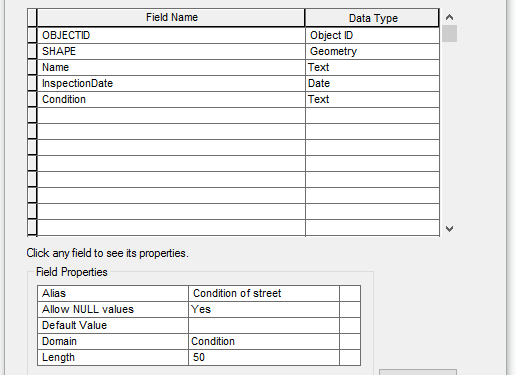
- The next field you create takes advantage of the coded domain created earlier in this lab. Click the next empty field row and type Condition. Choose Text as the data type
- Under Field Properties, type Condition of street as the alias for the field
- Click the empty text box next to Domain and choose Condition
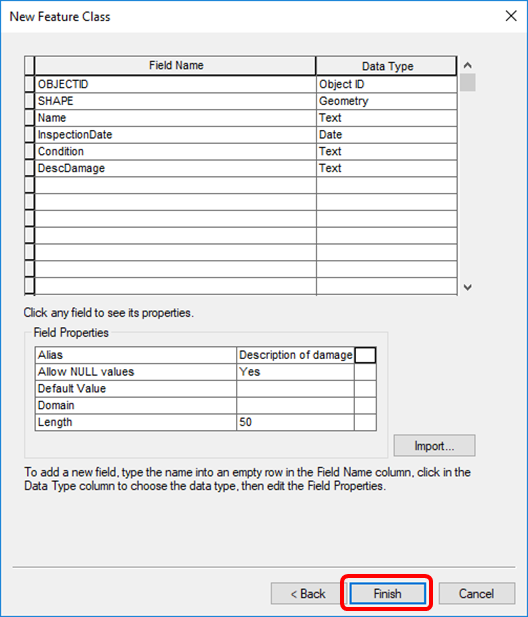
- The final field to add is the description field. Name this field DescDamage and make it a text data type. Update the alias to Description of damage
- Click Finish to complete the feature class creation
- To allow collection of picture attributes in the field and attach them to the assessment report, enable attachments on the feature class you just created. To do so, right-click the feature class in the Catalog window, choose Manage, and click Create Attachments
The feature class you created is added to the map and appears in the table of contents in ArcMap.
Theme your data
You've now created your information model. In this section, you will define how those features look on your map
- To update how your features look, right-click the layer name in the Table of Contents panel, and choose Properties
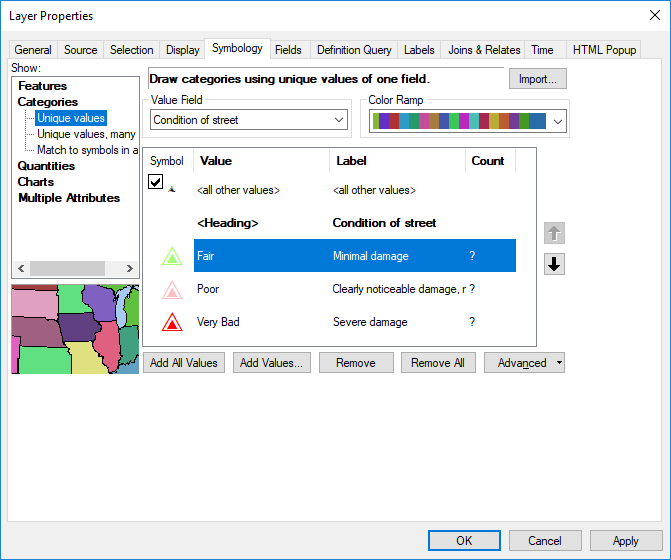
- Click the Symbology tab
- Click the Categories section under the Symbology tab and choose Unique values
- In the Value Field drop-down list, choose the Condition of street field and click Add All Values
- Right-click on Poor and choose Properties for All Symbols
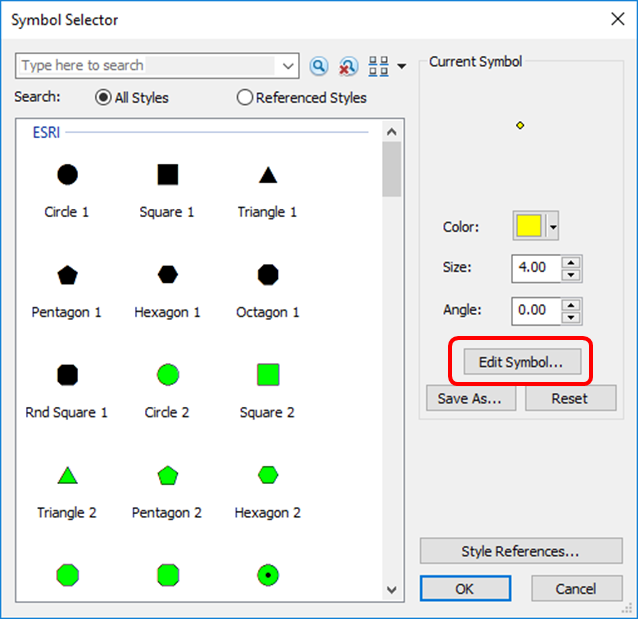
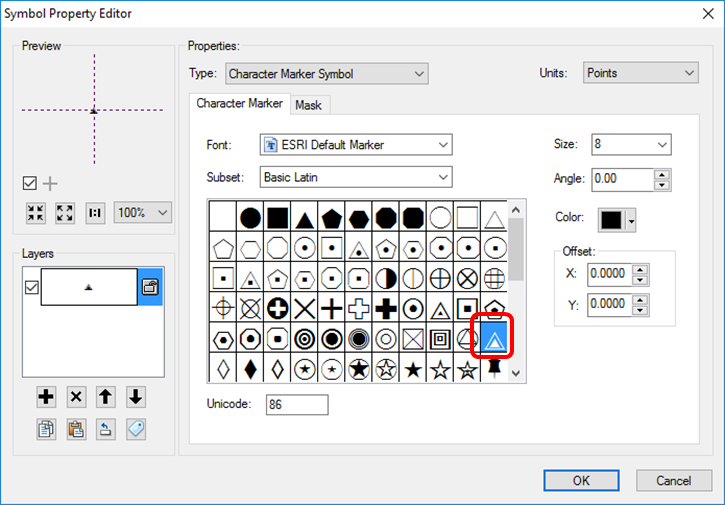
- Click Edit Symbol
- Under Type, select Character Marker Symbol and choose the symbol shown below and click OK
- Double-click each condition icon, and choose a different (appropriate) color for each of the condition symbols and set the symbol size to 24
- Click Apply and click OK. The symbols update in the table of contents
- Click File and choose Save to save your map document in the lab 10 workspace. Name your map document collector_lab.mxd
If your feature class is not yet on the map, drag the feature class from the Catalog window into the Table of Contents panel in ArcMap
Publish your data
Your data needs to be available online to use it in your map. You can publish the data to your ArcGIS Server or to your ArcGIS organization. In this lab, you will publish the service to your ArcGIS organization, where it will be available as a layer that you can add to your maps. Publishing requires an ArcGIS organizational account with the ability to publish hosted feature services. You will use the account you created for lab 12.
- If you're not already signed in to your ArcGIS organization in ArcGIS Desktop, sign in
- In ArcMap, click File and choose Sign in
- Click the File menu, choose Share As and click Service
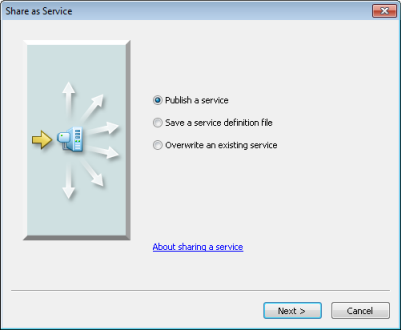
- The Share as Service dialog box opens
- On the Share as Service dialog box, confirm the Publish a service option is selected
- Click Next
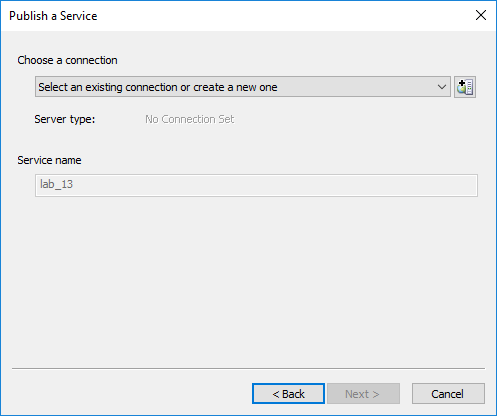
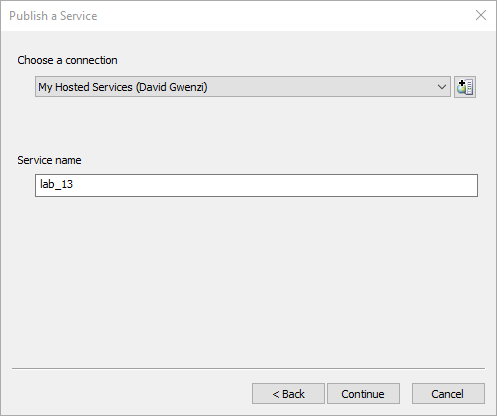
- On the Publish a Service dialog box, click the drop-down arrow and choose My Hosted Services (Your name)
- Make sure collector_lab is set as the service name and click Continue
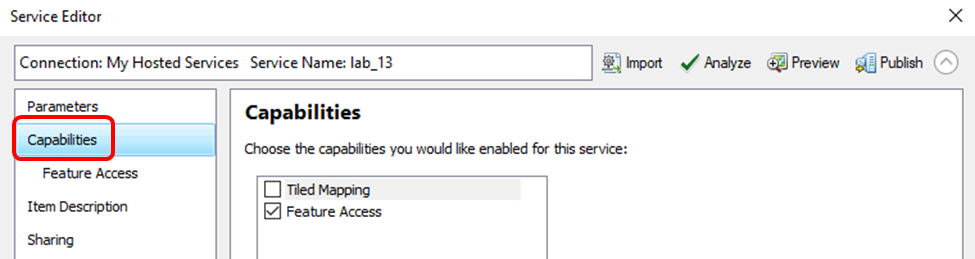
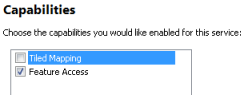
- In the left pane in the Service Editor window, click Capabilities
- In the right pane, check the Feature Access check box, and uncheck the Tiled Mapping check box
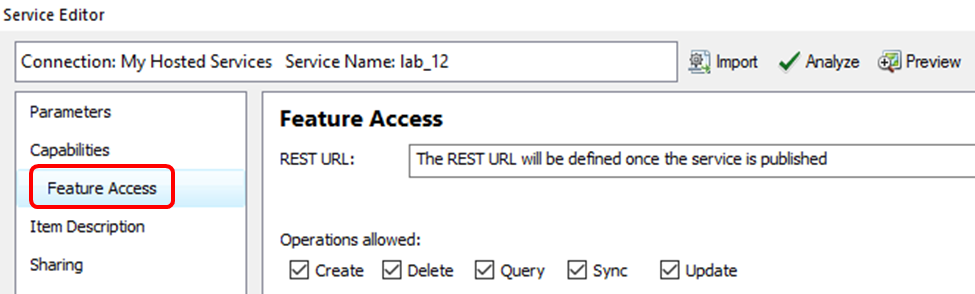
- Under Feature Access, check Create, Delete, Query, Sync, and Update
- These options specify what data collectors in the field can do with the data. For this lab, you need them to be able to add new damage incidences as well as edit and delete existing ones, so you enable options to create, update, and delete. Sync is enabled to allow you to take the map offline
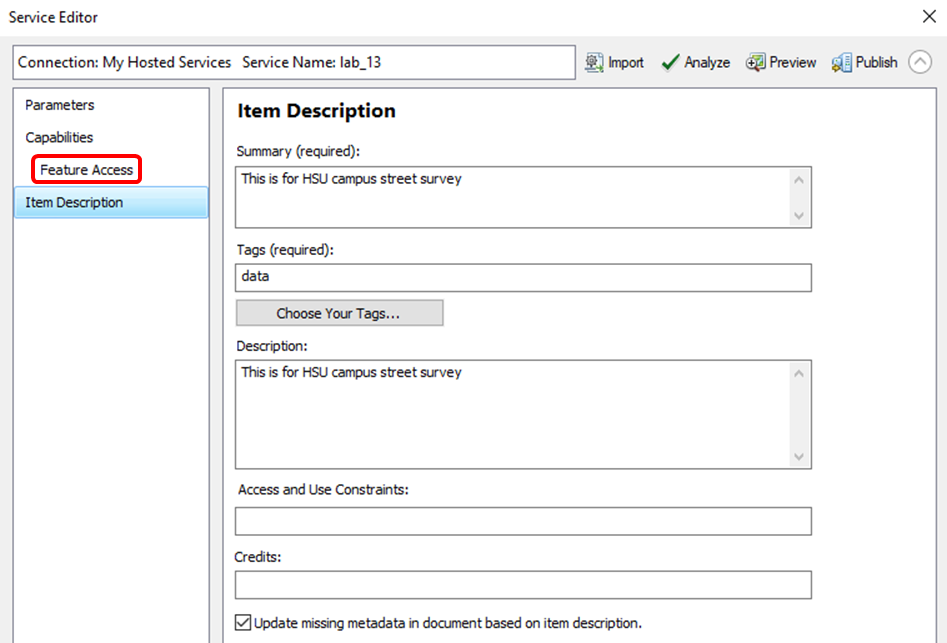
- In the left pane, click Item Description. Type data for the Tags (required) window and type the text for the Summary and Description as shown below:
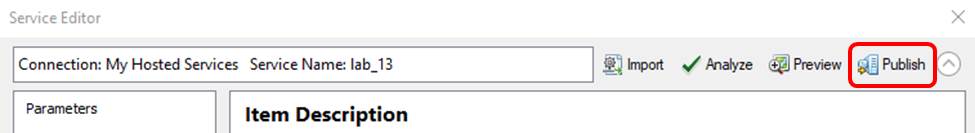
- On the Service Editor toolbar, click Publish
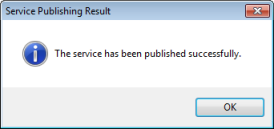
- Click OK on the result message
- Minimize ArcMap or exit the ArcMap application. Save your changes if prompted
The Publish a Service dialog box opens
The Service Editor window opens
This specifies that you will publish a feature service rather than a tiled map service.
You will see various status messages as the service publishes, and then you will see a Service Publishing Result message. This may take some time, BE PATIENT!
You are done for this first part. In the next part, you will learn to create and share a web map, collect data in the field, and download and analyze the field data in ArcMap.
Part 2: Create and share a map for you to use in the field
Try not to spend more than 30 (thirty) minutes on this part
Please note that the ArcGIS online interface is constantly changing so some page configurations may look slightly different from the instructions. Try to pay attention to everything you are doing so you can easily figure out the new settings on your own before calling for help. The reference to lab_13 in the figures is also outdated so make sure you reference to collector_lab instead
In this part of the lab, you will create a map to use to collect data about street conditions. You will build a map by starting with a basemap, adding the Street Conditions layer (that you published in part 1), configuring the data collection form, and customizing the application settings. Finally, you will share the map to make it available to anyone in your organization.
Create a map
- Open a web browser to your organization's home page. Go to www.arcgis.com/home
- Click the Sign In link in the upper right corner
- Log in using your ArcGIS online account details
- Click Map on the ribbon at the top
- Pan and zoom the map so that the Humboldt State University area is visible. You can also search for Humboldt State University in the search window
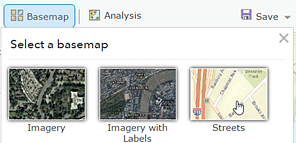
- Click Basemap and choose Streets
Your organization's home page appears

A new map named My Map appears, containing a basemap
Add a layer to the map
For your map to be accessible in Collector, add an editable feature layer.
- Click Add
- Set the In drop-down list to My Content
- Click Add on the collector_lab layer to add the result to your map
- Click Done Adding Layers at the bottom of the side panel
- So that you have some data to see when you first open Collector, you can add some data to the layer by doing the following:
- Click Edit
- Three feature types appear in the side panel, showing the symbols that represent the different conditions of the streets in the template. Choose the Minimal damage (fair) symbol in the side panel and click the map on 17th street, about halfway between B street and Wildlife Ln
- The attributes for the newly added feature are displayed on the map. Enter the appropriate information into the attribute fields as shown below:
| and choose Search for Layers |
The Search for Layers side panel appears.
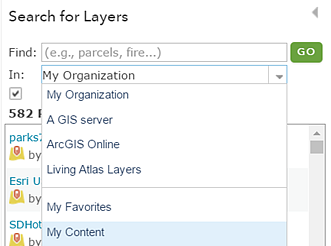
A list of relevant layers is returned. Do you see the layer you created in lab 12?
At the moment, nothing shows up on the map because our layer does not have data yet. Don’t worry, you will add some data later in this section.
The Search for Layers side panel closes, and the Contents side panel appears.
| on the ribbon |
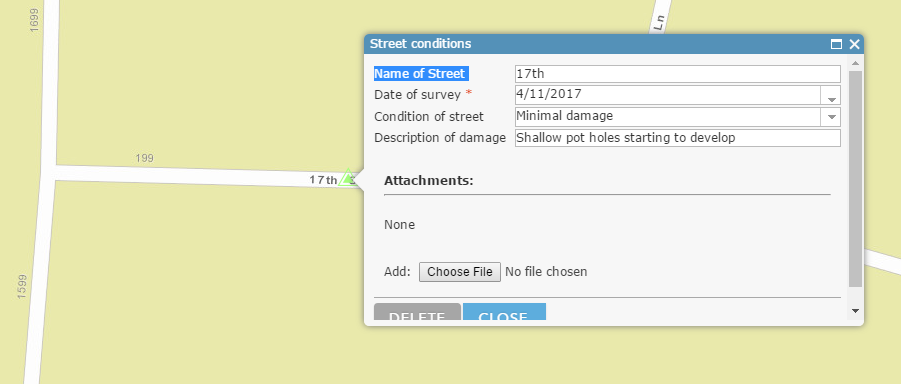
- Click CLOSE
A new feature is added to the map. Repeat steps a to c to add at least 2 more features of any damage extent. Ask your classmates if you don’t know any place with a certain extent of damage.
Save the map
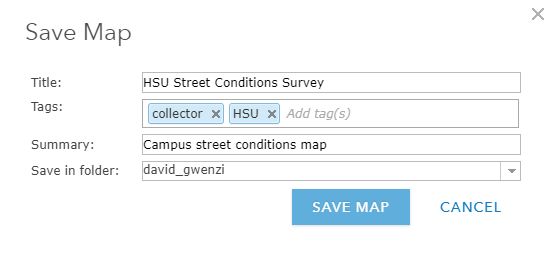
- Click the Save
- Complete the fields on the Save Map dialog box as shown or as appropriate. Hit Enter after each tag, if you are entering 2 or more
- Click Save Map
| icon on the ribbon and choose Save |
The Save Map dialog box appears.
Test the pop-up
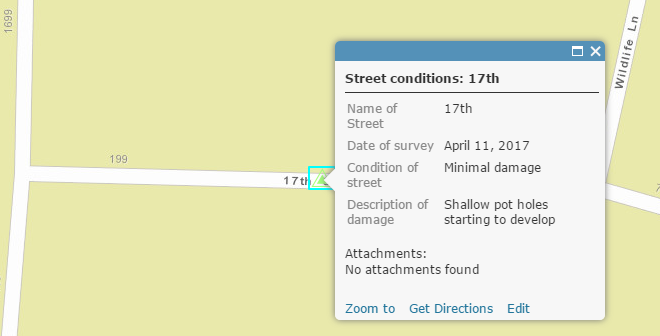
- Zoom in on the map to explore the Street Conditions of features you created above
- Click any one of them
- Close the pop-up
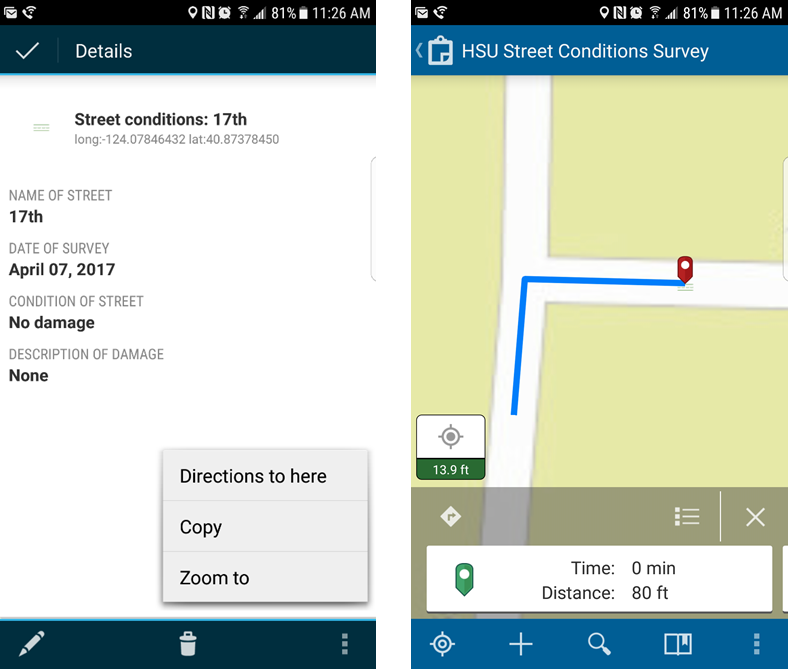
Information about the Street Condition displays. This information is available to anyone viewing the map. It also determines the information that can be collected while in the field. The same information shows in the pop-up here and in the app. The fields you see depend on the Street Conditions layer you added to the map. What you see doesn't necessarily need to match this image.
You have now made a map by adding a basemap and some layers, and you explored its pop-ups. Much of the value of this map lies in the information contained in its pop-ups. In the next section, you will see how to configure pop-ups to display the information you want to share.If you want to configure the pop up to look differently, follow the instructions under OPTIONAL below
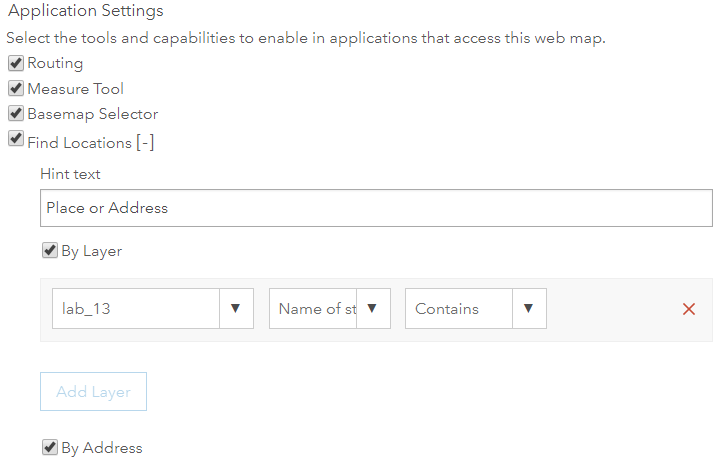
Customize the application settings
Some of the capabilities of maps can be turned on and off. These settings include the ability to route, measure, change basemaps, find locations, and track the location of collectors. By default, the routing, measuring, switching basemaps, and finding locations by address capabilities are enabled. In this section, you will turn on the find locations by layer (feature search) capability, so you can search features in the field.
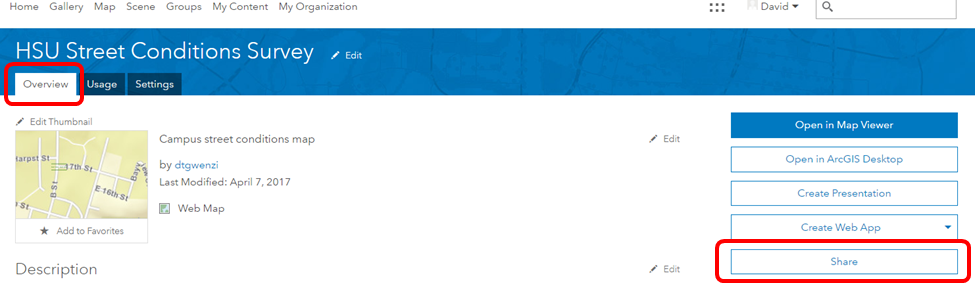
- Click the About
- Click More Details to go to the map's item details page
- Click the Settings tab
- All the way down, under Find Locations, check the By Layer check box to enable feature search for your map
- Click Add Layer to specify which layer can be searched. By default, the collector_lab layer is set to be searched for incident numbers
- Click Save to save your application settings
| icon on the side panel to display the map's details |
Your map is created, configured, and customized. It's ready to be shared with others in your organization.
Share your map
- Near the top panel, click the Overview tab and click Share
- On the Share dialog box, check the check both boxes to share the item
- Click OK and on the next window, click Update Sharing for the sharing to match that of your map
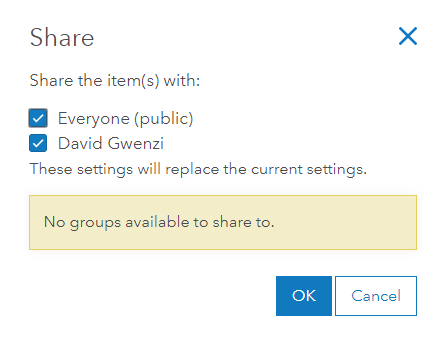
Your sharing options depend on the organizations and groups to which you belong. For large organizations, you will probably have several different groups you can choose to share with.
Sign in to the app to see your map
Your map is now ready to use in Collector.
- Start the Collector App on the tablet
- Sign in with your organizational account if you haven't already done so
- Choose ArcGIS Online to connect to your organization
- Provide the requested information to sign in
- Find and tap on your HSU Street Conditions Survey Map
- Select the Street Conditions Survey map card to open the map. The extent of the map that loads is based on your current GPS position
- Select an existing feature to open the pop-up you configured and see the information about the feature. You may need to tap twice
- Click the More
Note: This all depends on the feature you have selected, the existing features you see may not exactly match those shown here, but that's okay, you can look at any existing feature.
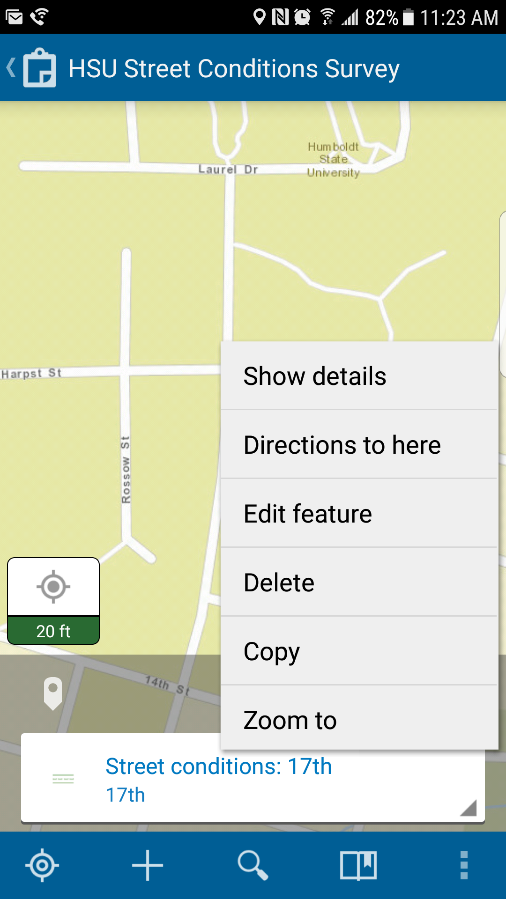
Actions you can take with the feature are displayed at the bottom of the pop-up panel.
| icon to see other actions you can take with the feature |
You ain’t too old school to operate a smart mobile device. You know better how to navigate your device. There is a lot you can do from here. Try out different things. You can even ask for directions to the feature, from your current position.
You have created, configured, customized, and shared a map for data collection. Your map is now ready to use in Collector and is available to all the members of your organization. Now you are ready to collect data on this map
Part 3: Collect Data
Try not to spend more than 1 (one) hour on this part
It will be handy to print instructions 1 to 7 and take the print out to the field, or make sure you have an electronic copy that you can access in the field
In this part of the lab you will learn to:
- Open the map
- Collect street conditions data
- Add a photo
- Save, share, and review the data
Open the map
- Start the Collector app and open the HSU Street Conditions Survey map
- To add a new incidence, click the + icon on the task bar and pick the appropriate condition
- Now, assume that you can view the damage, but you're not at its location. Perhaps it's inaccessible due to other things happening on the street. However, you still want the incidence that you collect to be associated with the correct location. By default, Collector used your current location to set the collection location; use the map to set a different location for the Street Conditions.
The Street Conditions Survey map opens. The extent shown reflects your current location.
| My Location | indicates your location on the screen and as you move, the map pans to remain |
| centered on your location. |
An intelligent data entry form displays in the panel. The contents of this form match what was authored as the pop-up for the map in ArcGIS Online. Notice that the location of the damage has already been set based on your location. In the next step, you will change that location by interacting with the map. For now fill in the form with the appropriate information and once you are done, click the check mark icon to accept the record you have just entered. For the date attribute, you can save yourself a lot of time by just choosing Use current. The incidence is shown on the map.
Note: You may receive a message saying that you have poor location accuracy, and the location of the incidence will say Unknown in the panel. For this exercise, that's okay. In the next step, you will use the map to provide a location. To use your location on the map, you can adjust your required location accuracy. Select the Settings icon and type a number in the text box under the Required accuracy section so that your current accuracy is within range of the required accuracy. When you're finished, select Close.
To place the incidence more precisely on a touch device, press and hold to get a magnifier, and use that to place the assessment. Click on the More icon and select Collect here.
Select the appropriate condition and provide required information in the form.
The incidence is shown on the map.
Add a photo
In the previous sections, you created a new incidence and collected the required data. Now you will add a photo of the condition as additional attribute for your Street Conditions.
- Use any method you wish to record a new incidence.
- On the task bar, click the Add attachments
- Take a photo of the damage.
- Select Use photo
| icon and in the pop up window, select Camera |
The camera opens on your device.
| or Retake | until you are satisfied with the photo. |
Once you accept a photo, you're returned to the app, and your photo is included in the panel and ready to be added to the current record. You can also shoo the photo first and then pick it from your gallery.
Collect at least 5 more damage incidences along your assigned street using any method of your choice.
Save, share, and review the data
You have completed your Street Conditions survey. Now you will save it, share it, and review it.
| Save the Street Conditions Survey map by selecting Submit |
Messages that show up indicate that the changes are being submitted and notify you of success. The feature is added to the server
You can see the Street Conditions you created on the map. Since your edits are saved on the server along with all the other Street Conditions data, your Street Conditions data is now shared with everyone using the map.
Back in the Office
This is what you will do when you get back to the office in a one man job. If a number of people are working on the project, there can be one person dedicated to downloading the data in the office as the field crew syncs the data they are collecting in real time.
- Log in to your organization account at www.arcgis.com/home
- Click on Content and then on the collector_lab Feature Layer (hosted)
- On the window that opens up, click Open in Map Viewer
- Pan and Zoom to the area where you collected your data
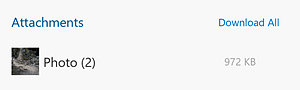
- To view a photo on your mobile device, select the photo.
- If your photo has already been downloaded, you immediately see the photo in full-screen mode.
- If your photo has not been downloaded, the photo placeholder
You should see the locations of all the incidences that you recorded in the field. To view a photo, simply click on the link shown under Attachments:
| turns into a thumbnail of the |
| photo you took. |
| After the download is complete, select the photo again to see the photo in full-screen mode. |
- In the full-screen viewer, select Back to return to the map.
Download the data into ArcMap
- Log in to your organization account at www.arcgis.com/home
- Click on Content and then on the collector_lab Feature Layer (hosted)
- On the window that opens up, click Export Data and choose the format the you want e.g Shapefile. If you want to view the images in ArcMap, choose the FGDB format
- In the window that pops up, give your export an appropriate name and enter Data under Tags: and hit Enter
- Click Export. It may take a few minutes to prepare the data for export. Again be patient!
- On the next window, click Download
- Save this file in your working directory and extract the data.
A zip file with the data will be downloaded to the Downloads folder of your computer by default but you can redirect it
Tasks
- Download your data as a shapefile and save the zipped file in the directory:
G:\Team Drives\GSP330 Spring 2019\lab_data\lab_10 - Name the file according to your team name, e.g Team_A.zip
- Challenge : When everybody has uploaded their data, copy the zipped files to your own working directory, exctract them, and combine all the shapefiles into one.
- Create a professional map of the campus street conditions
OPTIONALS
Here are some other cool things you can do with collector. Feel free to try these out later in your own time.
1. Go offline
In this section, learn to:
- Download the map
- Use basemaps on your device
- Sync your work
- Remove maps and basemaps from your device
In the field, you often work in areas without a data connection. If that's the case, you can download the map to make it available when you do not have a connection. You can also download or copy basemaps directly to your device and reuse them across multiple maps. Once you have your map offline, you can work with your map, including collecting and editing data, in the same way as when you're connected.
Finding places requires an Internet connection when working with an online or offline map. You can search your own data without a connection if your map has feature search enabled. When using an offline map, you can't switch to an online basemap.
Download the map
To work offline, download the map to your device.
- If your map is available for download, select Download
- Using the map, zoom in or out as needed until you can see the entire work area that you need to download.
- Select Map Detail and zoom in or out until the map is showing the detail you need to work with in the field.
- Select Download.
- When the map has finished downloading, you can open and use the map without an Internet connection.
| to start downloading the map. |
Note: Only maps that can be taken offline have the Download option on their map cards. To support taking a map offline, the author needs to prepare the map for offline use If you previously downloaded or copied a basemap to the device, you can reuse that basemap.
The work area is the extent or geographic area of the map you download. Before downloading, make sure you can see your entire area of interest.
Map detail determines the quality or resolution of the map you download. Before downloading, make sure you can see all of the information you need on the map.
You are taken back to the Map Gallery and the map downloads. Depending on the size of your map, the download could take some time. During download, a progress bar displays and a cancel option is available.
2. Use basemaps on your device
Basemaps provide the frame of reference for your data. When working offline, you can use basemaps on your device instead of downloading a basemap for each map you use offline. This has a few advantages: it's faster in most cases and allows you to prepare basemaps for much larger areas.
- Prepare a tile package (.tpk) using ArcGIS Desktop. For details, see How to create a tile package in the ArcGIS help.
- Open Collector: Click the Menu
- Select Basemap
- Browse to the tile package you prepared, select the tile package, and select Open.
- To use your newly added basemap, take the following steps:
- Open the map with which you want to use the basemap.
- Select More..., Basemaps
- Select the newly added tile package (.tpk).
| icon and select On Device |
The Open dialog box appears.
The Basemaps tab of the On Device map collection displays, showing your added basemap.
| , and select On Device. |
Sync your work
| Sync allows you to send and receive updates for maps you've taken offline. Anytime you regain connectivity and |
| want to check for new updates or send your updates for other people to see, select Sync | on the map card |
| in the Map Gallery |
You can configure Collector to only push your edits up to the server when you sync, and not to pull down edits made by others while you were offline. This reduces the amount of data transferred, making it faster to share your changes, and saving data transfer costs on cellular networks. If the edits being made by others are important to you, leave Push Only synchronization disabled.
| To enable push only synchronization, click the Menu | icon then select Settings | , and select General |
Turn on Push Only synchronization.
Note: If you aren't seeing expected updates to features that you are not currently working on, you might have enabled Push Only synchronization accidentally. If you aren't seeing any features besides those you've added, or attachments for features you are not currently working on, your map author may have configured the map to limit the data retrieved from the server. Enabling Push Only synchronization overrides the author's settings.
Remove maps and basemaps from your device
Occasionally, you may need to manage the maps or basemaps on your device. You may want to remove the map for a number of reasons: you're finished with it, it's out-of-date, it's taking up too much space on your device, or you want to use it while connected.
To remove a map or basemap, select Menu and select On Device. Switch between maps and basemaps to access the content you want to remove from your device. Find the map card of the item to remove, select More... and select Remove.
Note: If a basemap is being used for one or more maps, you cannot remove it from your device without removing the map or maps first.
When removing a map, you can remove the entire map (including the basemap), or you can remove the map and save the basemap for future use. This is useful if you expect to reuse the basemap with another map.
3. Configure the data collection form
In the previous section, you made a map by adding a layer and explored the details exposed in the pop-ups. You can customize the information the pop-ups display, as well as the information collected in the field.
- Click Show Contents of Map
- On the side panel, hover over the Street Conditions layer and click the small ellipsis to the right of the tools and choose Configure Pop-up .
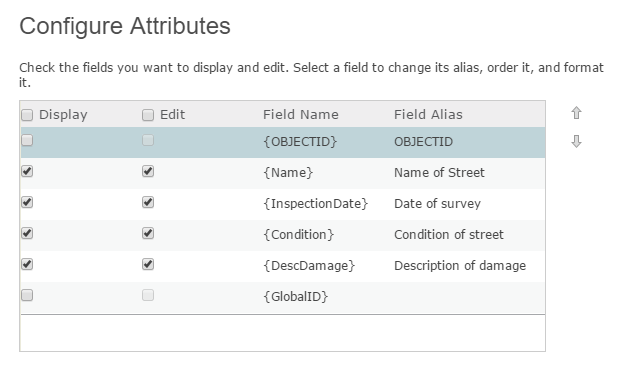
- Farther down the Configure Pop-up panel, in the Pop-up Contents section, click Configure Attributes.
- On the Configure Attributes dialog box, in the Display column, check/uncheck the check boxes for what you want ddisplayed/hidden, as you prefer
- Click OK to close the Configure Attributes dialog box
- Click OK at the bottom of the Configure Pop-uppanel
- Click a Street Condition on the map to see its updated pop-up
- Close the pop-up on the map
- Click the save
| on the side panel to display the Map Contents panel. |
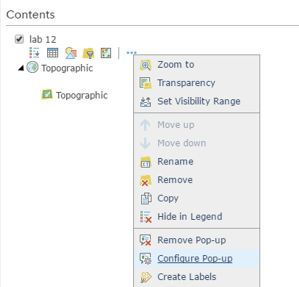
The layer properties context menu appears.The default pop-up title consists of the layer name (Street conditions) plus a field name in curly brackets. The fields come from the data in the layer on your map. In this case, the field name is Name
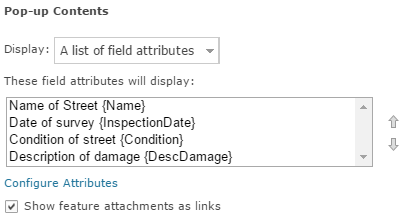
The Configure Attributes dialog box lists the features' fields by their display state (on or off), field name (which can't be changed), and field alias (which can be changed).
| |
icon on the ribbon and choose Save |