Creating Reports in MS-Word
Introduction
Microsoft Word is the most popular software application for creating office documents within the United States.
Here is an example of a simple report created in MS-Word with comments to help you create a similar report.
Data
Below is a sample dataset that can be used for this lab or you can use your own data.
Creating a Report
Being your report with a concise title that gives the purpose of the report and the name of the location of interest. Then, select the title with your mouse and select the "Title" style from the "Home" tab. Just below the title type your name and the current date. Select this new text and then select the "Subtitle" style.
Using styles will give the elements in your documents a standard set of font characteristics. More importantly, later on you can try different overall styles and they will be applied to your entire document.
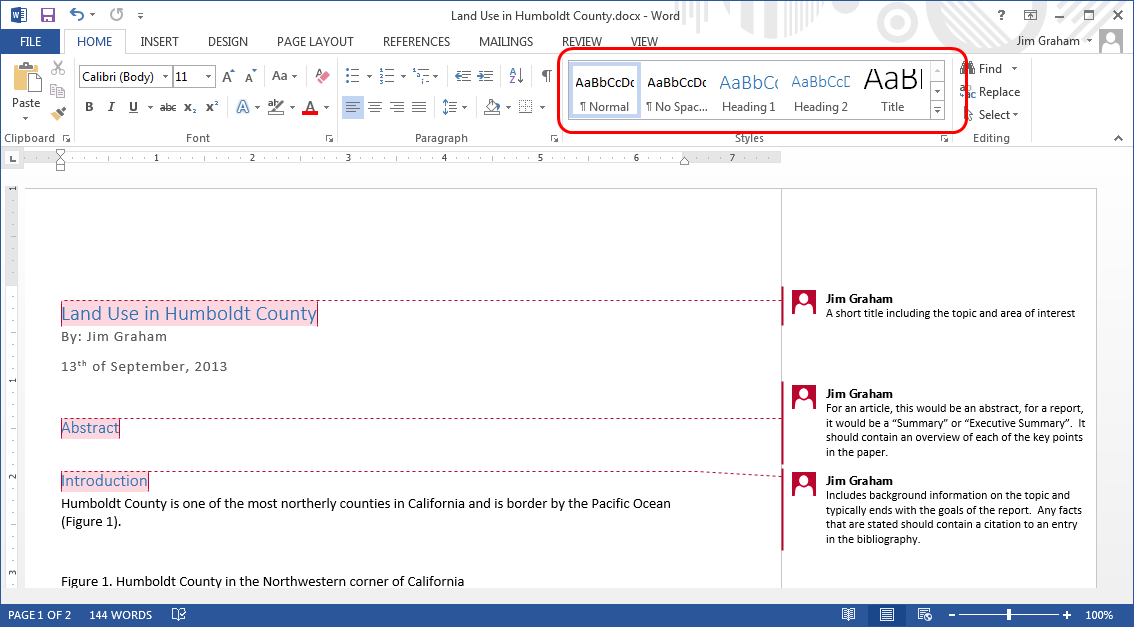
Now type "Abstract", select this text and select the "Heading 1" style. Abstracts, also called "Executive Summaries", are short summaries of the entire report. Abstracts only appear in relatively long documents and are written after the entire document has been completed.
Type "Introduction" and again, select the "Heading 1" style. The "Abstract" and "Introduction" are sections within your overall document. Add section headings for "Methods", "Results", "Conclusion", "Acknowledgements", and "Bibliography".
Click on the "DESIGN" tab in MS-Word and then try some of the different "Styles" for your document.
The sections below will lead you through creating the rest of the material.
Content
Introduction
Just after the Introduction heading, describe the purpose of the report and then some background for the content of your report. This typically includes a description of the area of interest (which may include a "site" or "locator" map), information on the topic of interest, and any background on the methods that were used in the study that resulted in the report. Any sources that your used for background information should be added to the "Bibliography" section and it is easiest to do this as you create the introduction.
Methods
The methods section describes the steps that were used to conduct the research. The content of this section varies with each report but can include: 1) how data was collected, 2) how the data was qualified for the study, 3) the analysis methods that were used, 4) and the methods for final production of the products including this report and data sets.
Results
The results section contains what was discovered during the study. This often includes maps showing the results and tables of figures from analysis. The direct implications of the results are included.
Conclusion
All documents should have an "Introduction" and a "Conclusion" section. They may be called something else but they are important to "wrap" the content with an overview of what the user is going to read about and then a summary of what they read and it's implications.
The conclusion should recap the most important findings in the report. Then, it should give potential broader impacts for the content. Finally, it should caution the user on the limitations of the results and give guides on future related work that could be carried out the address the limitations.
Acknowledgements
This is an optional section but should be added if the sponsors of the report are not part of the organization that created the report or if data and other work were contributed by folks not mentioned as authors. Simply thank each person or organization that contributed and their contribution to the report.
Bibliography
The entries in the Bibliography are referred to as "Citations" and most organizations have a standard format that they use for citations. For now, you can use a format that contains the following items in the order shown:
- Primary authors last name followed by their initials. If there is no author, use a short name of the organization that created the material (e.g. "NASA").
- Any secondary authors with their initials followed by their last name (i.e. reverse order of the primary author).
- The year the material was published.
- The full title of the material.
- The source of the material. This is the publisher for books and articles and would be the full name of the organization that created the material for others (e.g. "National Aeronautics and Space Administration").
- Detailed information o the location of the material. This would be a URL for web-based content, the chapter and page for books, and the volume and page numbers for articles.
- You can also include a "Digital Object Identifier" (DOI) if available.
Adding Maps
Adding maps can be tricky and even when they look OK in MS-Word, there can be problems in future editing or printing. Also, maps in reports rarely take up an entire page so they need to be simpler than full-size maps. Because of this, reports typically include a series of small maps.
Create a site map of your area of interest. This should be a simple map with few colors that shows the area within a larger area that will be easily identifiable by the reader. In ArcMap, create a small map, about 1/4 of the page, that contains just a scale bar and north arrow if needed. Add a "neat line". The map does not need a title because the caption in the document will provide a description of the map.
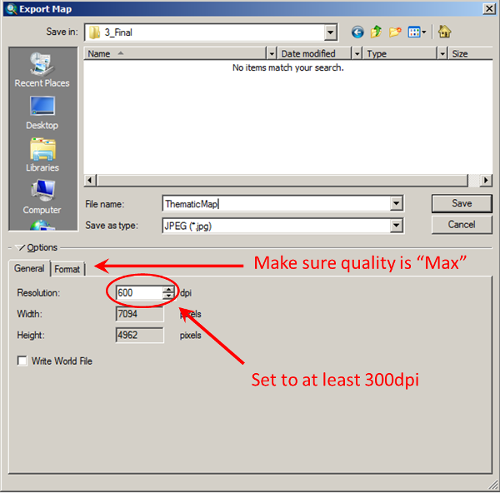
Select "Export Map..." from the "File" menu and save the map at at least 300dpi to a "JPEG" file. This is a minimal resolution for desktop printing. Professional printing presses can go as high as 1500dpi but this makes for very large files.
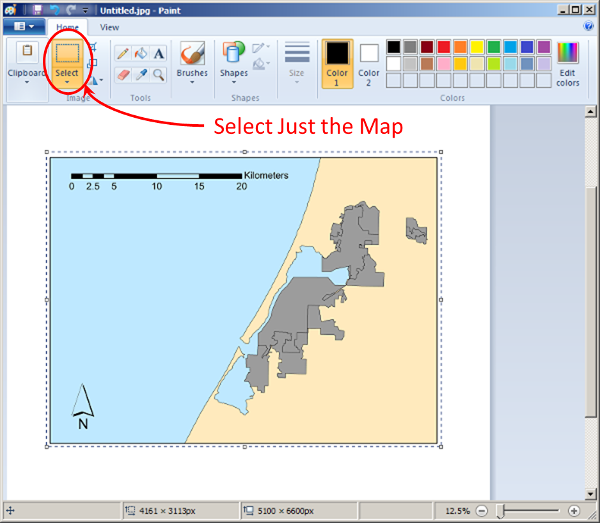
Next, open the file in a painting package such as MS-Paint. Open the file you saved and then use the Zoom tools in the "View" tab to see the entire page. Next, use the selection tool to select just the area of your map just outside the neat line.
Copy this to the clipboard and then switch to MS-Word. On the "HOME" tab, click on the arrow below the "Paste" button and select "Paste Special...".
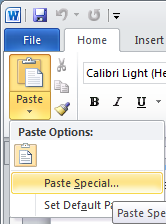
If the type of paste in the "As" box contains the word "Object", you'll want to change this to a standard format such as "PNG", "BMP", or "Device Independent BitMap". The object formats maintain communication with the application that you created the image in and can cause all kinds of problems with your documents, especially when you send them to others for editing.
Next, right click on the image, drag to "Wrap Text", and make sure "In Line with Text" is selected. This will treat the image as a large character. You'll need to add "returns" (clicking "enter" on your keyboard) before and after the image but the image will move with the text making it much easier to edit your documents. Finally, right after the image, hit return and type a caption that starts with "Figure X." where "X" is the number of the figure within your document, starting with 1.
Sometimes, the map elements within ArcGIS are just not high enough quality or flexible enough for final maps. One way around this is to make some of the map elements in ArcGIS and then use the steps above to bring the pieces into MS-PowerPoint, Adobe Illustrator, or another graphics art package. Then, you can add a rich variety of elements to your maps and have great control over their placement. Typically for this, you will want to add the neat lines in PowerPoint rather than in ArcGIS. Then, you can paste the final image into MS-Word as we did before.
Adding Tables
You can add tables to MS-Word from the "Insert" tab. then, you can just type information into the table.
If you want to bring tables in from Excel you just want to avoid pasting them as "Objects". Instead, create the table in MS-Word and then copy and pate the contents of the table into MS-Word.
Another difference is that the caption for a table is typically above the table and starts with "Table X." where X is the order of the tables in the document from 1.