Lab 5: Digitizing HSU
Introduction
In this lab we will be continuing to exercise our digitizing skills by digitizing features from a georeferenced source. This includes three different data types: points, lines, and polygons.
Scenario (fictional but very similar to real projects):
- The city of Arcata has just obtained high resolution aerial imagery for the entire city, including HSU. HSU does not have a high resolution GIS dataset that is up to date. Our mission is to create the best accuracy dataset we can for a wide range of projects.
Your task, is to work with the other students in GSP 510 to divide up HSU into areas for each pair of students in the class. Then, the class will digitize the buildings, roads, and sidewalks (at least). Each pair of students should check the others work and then the data will all be stored in the GoogleDrive so everyone can access it.
Learning Outcomes
- Digitize point, polyline, and polygon features
- Add minimal formal metadata
- Estimate uncertainty
- Calculate distance
Skill Drill: Setting up your Workspace
First we need to set up our workspace.
- You'll want to work on the virtual lab for this because you have to be inside the HSU netowrk to access the rather large dataset for the aerial photos
- Set up workspace/folder structure. By now you should be familiar with this process. Be sure to include your three sub-folders: 1_Originals, 2_Working, and 3_Final.
- In ArcGIS Pro, add ""L:\gis-data\_Areas Of Interest\CityOfArcata\CityOfArcata_AerialPhoto_3Inch\Ortho_TIFF\Arcata_2017.gdb" to Catalog and then load the raster data
Walk Through: Determining the Spatial Reference System
We need to check the spatial reference system for the basemap image to make sure we correctly project the shapefiles we create later on in this lab.
- The image is a high resolution aerial image of Arcata. The image is stored in an Esri Geodatabase. This is the typical method to have ArcGIS products access large raster datasets.
- Check the spatial reference system for the image and find out which one is used.
- Right click on the layer name. This will be the name of the image file in the table of contents, NOT the word "Layers".
- Select "Properties"
- Select the "Source" tab
- Scroll to the "Spatial Reference" Section and take a note of what it is. You will refer to this information when creating your new shapefiles.
- In your "2_Working" folder, create a new folder that includes the name of the spatial reference from the NAIP image. Copy the NAIP image into that folder.
Note: Do not try to reproject the NAIP image. It is relatively large and will take quite a while to reproject.
Skill Drill: Digitizing
We want to have data for the area surrounding Arcata Forest. The problem is that there is a lot of forest. We have a large class filled with talented GIS researchers. Divide the class into groups of two and assign each group a section of the boundary of the forest. Make sure each group has a section that has at least six houses in it. Note that this means some of the sections will be longer than others, that is OK as digitizing is faster is there is less to digitize.
Make sure to come up with a solution for everyone to exchange their data and then start digitizing! Below are some tips to help as you digitize:
- Draw your the features in your area by editing your new shapefiles (create new features in the shapefile)
- See Lab 1 Instructions if you need help
Note: The resolution of your images will change the accuracy of your digitizing (i.e. you cannot digitize better than the size of a pixel in your rasters) but the accuracy will also be influenced by how many points you add and how careful you are. As you digitize, estimate about how closely you are following the actual features shown in the image. You will add this information to your metadata.
- Save edits/stop editing when you are done
- Zoom in on your digitized areas as far as you can, notice that your digitized lines and polygons may not match up perfectly? Try to estimate the number of pixels you are off by, just a rough estimate, which can give us an idea of the level of uncertainty. (Example: my uncertainty is about 30 meters/3 pixels). Include this information in your metadata and final report.
- As a last step, add one of the "Imagery" backgrounds to your map and zoom in to your area. This image is much higher resolution but we know very little about it. Think about how the quality of your digitizing could improve with access to this type of data.
Skill Drill: Creating New Shapefiles
Next you will create shapefiles that will contain the shapes you digitize (buildings/trees/etc.).
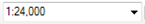
You should keep a constant scale when digitizing, and you need to record the scale in your metadata. You can locate the scale of your image on the tool-bar in the ArcMap interface (see below):
Note: Make sure you create the files in your "2_Working" folder. This will make it easy to turn them in later. Be sure to match the projection used by the satellite (NAIP) image and give your files good names!
- Create new shapefiles for digitizing (See Lab 1 for a refresher on how to complete this task). Be sure to match the projection used by the satellite (NAIP) image.
- Polygon shapefile for buildings/houses
- Point shapefile for trees/light posts/fire hydrants
- Polyline shapefile for streets
- Additional features? Include more shapefiles if desired
- Before saving your "mxd" file make sure the file is set to "Store relative pathnames to data sources", otherwise, if you move your files to another computer or folder, ArcMap will not be able to find them. This option is available in "File -> Map Document Properties".
- Add the Editor toolbar window
- If the "Editor" tool bar is not visible:
- Select the "Customize" button at the top of the ArcMap interface
- Select "Tool bars"
- Click on "Editor"
- This will add an editor toolbar to your ArcMap interface
- If the "Editor" tool bar is not visible:
Walk Through: Attributes
In addition to spatial data, we also want to be able to work with "Attributes" for our spatial features. Attributes allow us to add labels, addresses, names, and a wide variety of measurements to our data.
- First, make sure you have stopped editing.
- Right click on one of your digitized layers and select "Open Attribute Table".
- Click on the little arrow in the upper left corner of the window that appears and select "Add Field..."
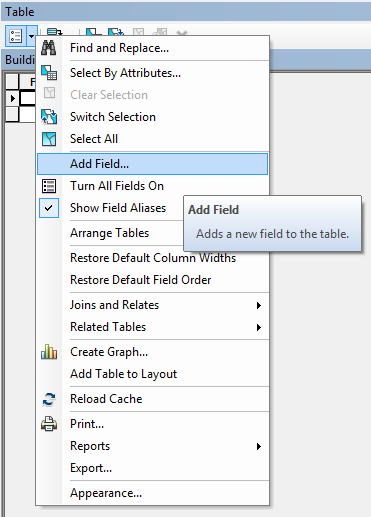
- In the dialog that appears, enter "Name" in the "Name" field and select the "Type" as "Text".
- Add another text field for "Notes".
- For your buildings and streets layers:
- Select "Add Field" again.
- For your buildings layer, enter the name as "Area", for your streets layer use "Length".
- Select the "Type" as "Double"
- You can only create fields outside of an edit session but you can only edit attributes in an edit session so start an edit session now.
- Enter good names for your features.
- For your buildings layer:
- Click on "Area" at the top of the attribute table and select "Calculate Geometry".
- Leave the other sections as they are and click "OK".
- ArcMap should compute the area of your buildings and these are relatively good measurements because we are in a UTM spatial reference.
- For your streets layer:
- Repeat the process above except use the "Length" attribute and set it to the "Length" of the streets.
Spend some time now investigating the features in your section of the forest boundary. The Humboldt County "parcels" data set has information on the zoning for parcels. Your can also use background layers to find the street and creek names in your section. Make sure you create a good "Name" for your features and add "Notes" as appropriate.
Labeling Features
One of the things you can do with attribute is label your features.
- Enter the properties dialog for your buildings layer
- Select the "Labels" tab.
- You'll need to check the "Label features in this layer" check box and select the "Label Field" as "Name" to have the labels appear.
- When you click "OK", you should see the names from your attributes table appear in your buildings.
Note: ArcGIS does not do the best job labeling features. It is OK for analysis but typically we have to remove the labels in ArcGIS and then add them in another package to make them professional quality.
Walk Through: Creating Metadata
Metadata is information about the data, (i.e. when it was created, where, by whom, etc,). It is absolutely necessary for all data files if they are going to be useful to others.
To add metadata, we must first select the "format" for the metadata. We'll be using the International Standards Organization (ISO) 19139 standard which is replacing the existing FGDC standard for US spatial data. Once we select this format, ArcMap will show us which fields in the metadata are required as we really don't want to fill out all of them (there are lots).
Note: The computers in this room reset every night. You will have to complete the following step (17) EVERY TIME you want to view and edit metadata! You may want to write it down.
- Select metadata format
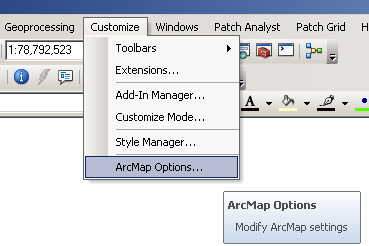
- Click the "Customize" button at the top of the ArcMap interface
- Select "ArcMap Options"
- Select the "Metadata" tab in the ArcMap Options window
- Click the pull down menu for "Metadata Style"
- Select "ISO19139 Metadata Implementation Specification"
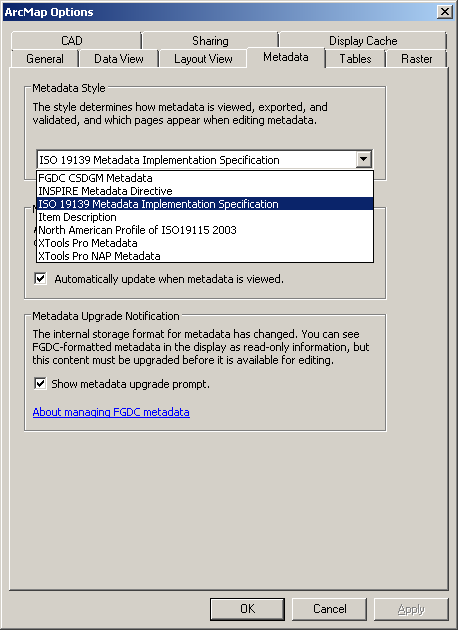
- Click "OK"
- Create the metadata
- In the catalog window, right click on your first shapefile
- Select "Item Description"
- In the item description window, select "Edit"
- Each section with a red "x" in the "Overview" panel needs to be filled out before saving the metadata.
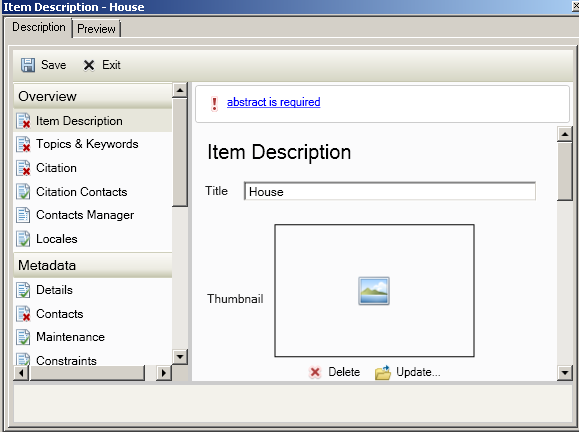
- Each section will show the items that need required metadata at the top of the edit window with a red exclamation mark. Sometimes, you can click on the link next to the exclamation mark and it will take you to the section that needs data. Other times you will need to look for it in the sections below. The areas that need metadata will be colored "pink". Clicking in the text entry boxes will show a hint in the space at the bottom of the window. This can help determine what should be in each entry.
- You can use the Metadata Quick Reference to determine which fields to enter data into and what to put in them.
- Fill out the required items until you reach the "Fields". This is where you will enter information about the attributes in your shapefile.
- Click on "Fields" in the "Overview" panel.
- At the top of the edit panel, you'll see that a "minimum" and "maximum" range value is required. Click on the arrow next to "Attribute: ID" (or "Attribute: FID") and then click the plus sign next to the "Range Domain". There should be two boxes that are colored pink indicating they need to be filled in.
- Enter "0" for the minimum and "Infinity" for the maximum (the word "Infinity" must be capitalized).
- Continue filling out the metadata until all the red "x"s in "Overview" panel are gone.
- Repeat this for the attributes you created in the files.
- Note that this adds an "XML" file to each of your shapefiles. You can either examine this data in ArcMap or in a web browser
Note: The red "x"s in the edit window do not mean you need to add metadata, they are for deleting items from the metadata.
Skill Drill: Finish Creating Metadata
- Now continue to add metadata to your other files on your own.
If you are having trouble with this section, see the video below:
Skill Drill: Zipping Files
At this point you should have a set of shapefiles in your "working" folder. We now need to zip them and upload them to Canvas.
- First, stop any editing and make sure you close ArcMap so your files are not locked.
- In Windows Explorer, navigate to your "2_Working" folder and then into the UTM folder.
- Select all file files except the NAIP imagery (which is too large to upload). Right click on the selection and select "7-zip -> Add to <name of your folder>.zip". This will create a new "zipped" file with all your shapefiles in it.
- Drag and drop your zip file into Canvas.