 R for Spatial Statistics
 Testing for Normality (QQ-Plots)
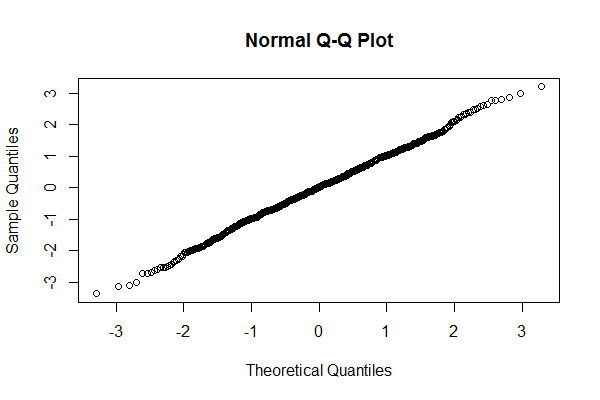
QQ-Plots
QQ-Plots are a more rebust test for normallity and provide visual feedback on the nature of the data. It is also recommended to histogram the data to see if it appears normal.
Executing a QQPlot in R is really easy:
TheVector=rnorm(1000,mean=0,sd=1)
qqnorm(TheVector)
Other Resources
Issues with Tests for Normality